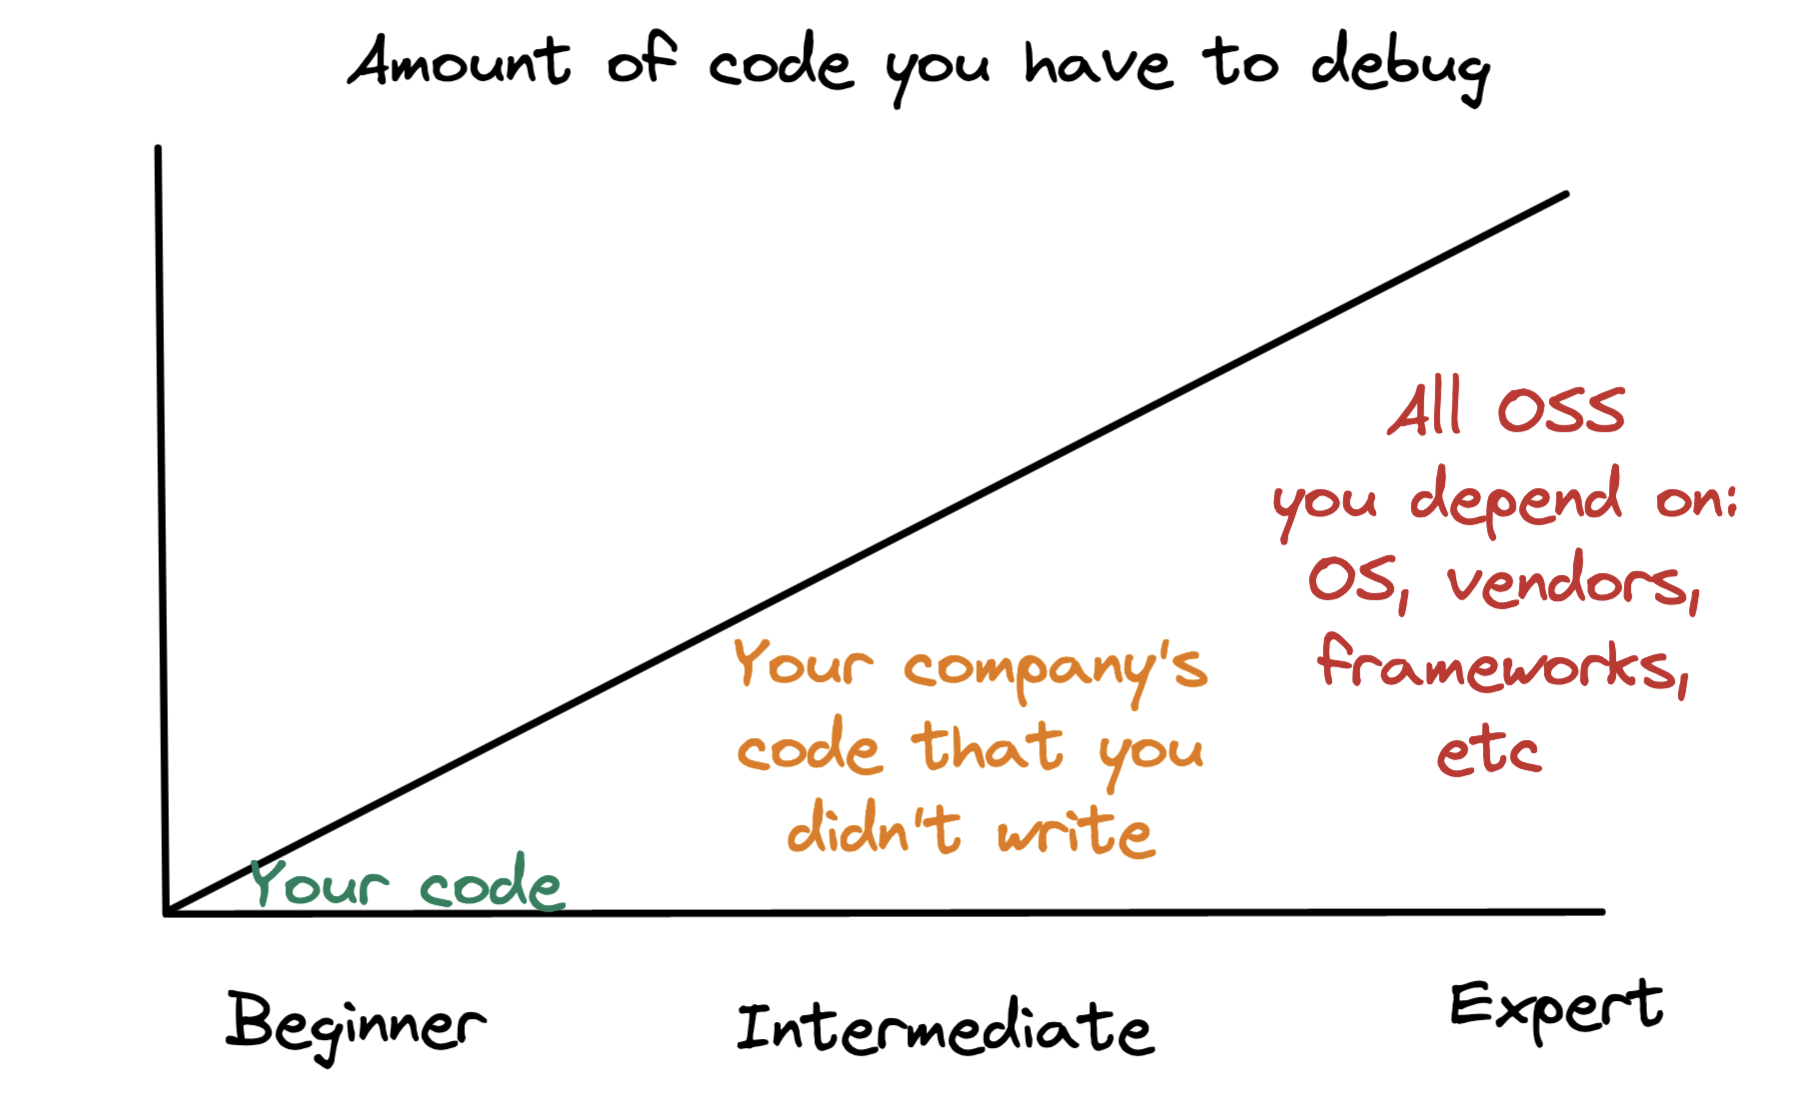
Debugging is one of the most difficult parts of working with computers. Worse, you have to do more and more of it over time as you become responsible for mountains of code you didn’t write.
(At least we don’t have to deal with God-tier bugs like my car doesn’t start after buying vanilla ice cream)
At work my last promotion was due in part to my problem solving abilities—my boss called me “a world-class debugger”. Here I will try to lay out the process I use and my best tricks.
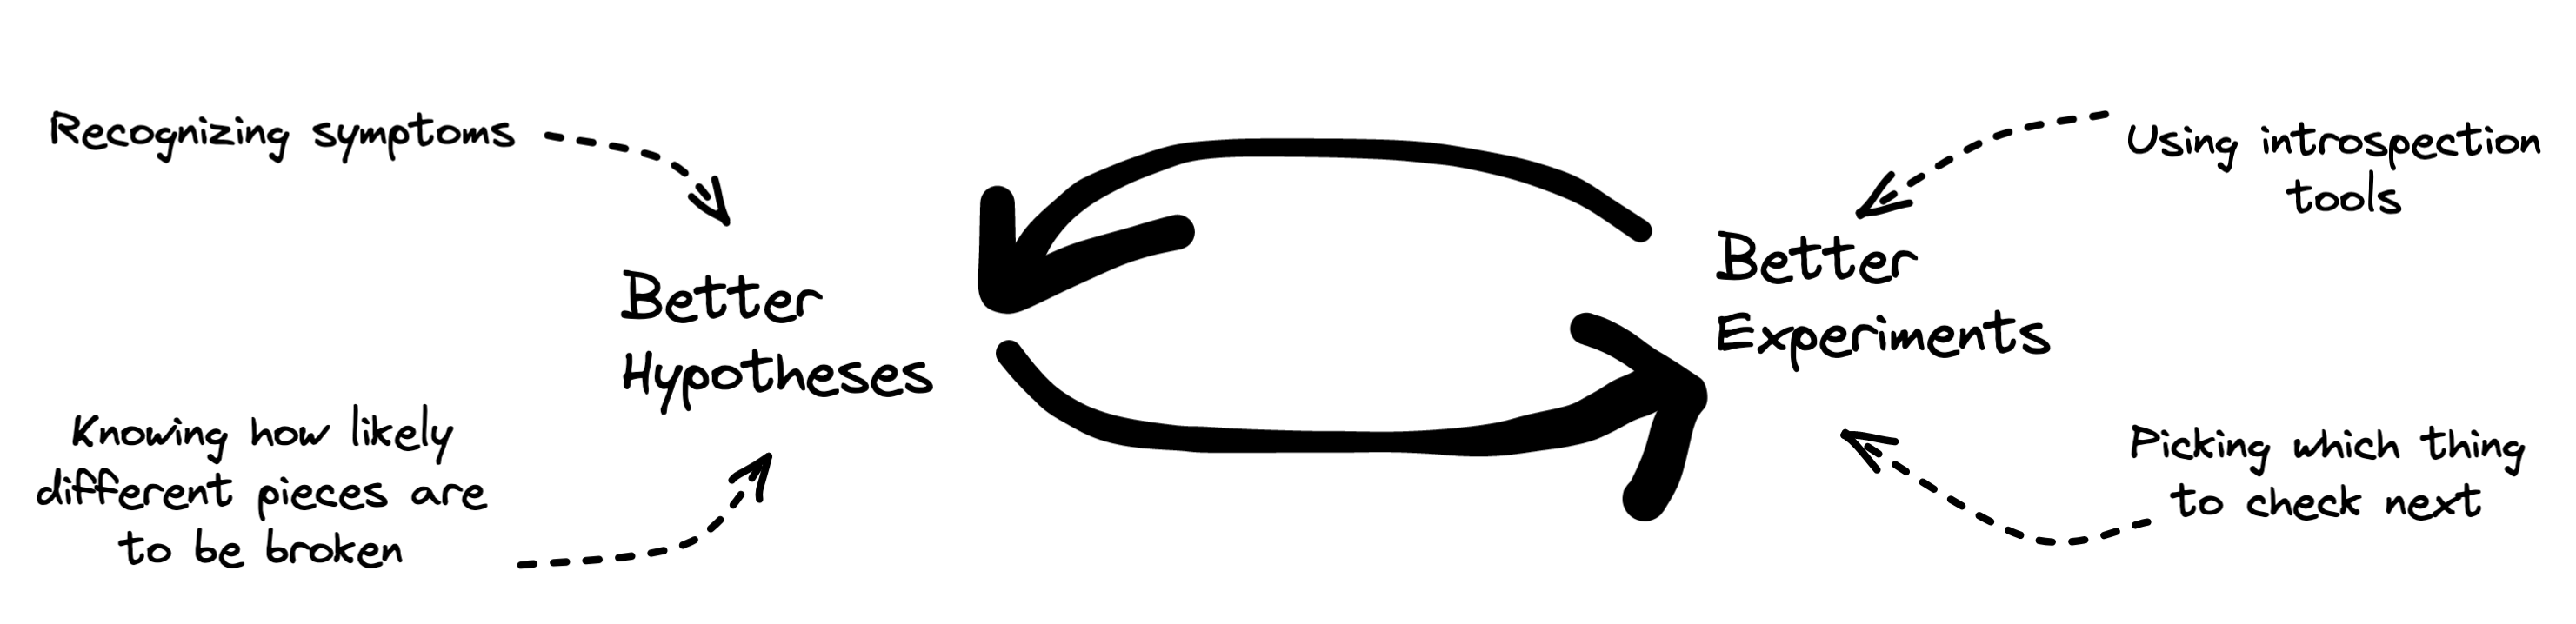
If it looks a bit science-ey, it’s because I cribbed it from a model of how scientists work1. When I’m debugging I like to think of myself as a scientist in a lab coat indifferently observing a phenomenon.
Think of Yourself as a Scientist
On top of feeling fancy with our imaginary lab coats and safety goggles, this has the huge emotional benefit of reducing our frustration with whatever we’re debugging. It gives us distance from the bug instead of feeling like an idiot for not understanding our own code, or not getting something we think should be simple. And it provides us with important metaphors: we can talk about navigating a hypothesis space by doing experiments. The hypothesis space is the haystack of possible causes for the bug:
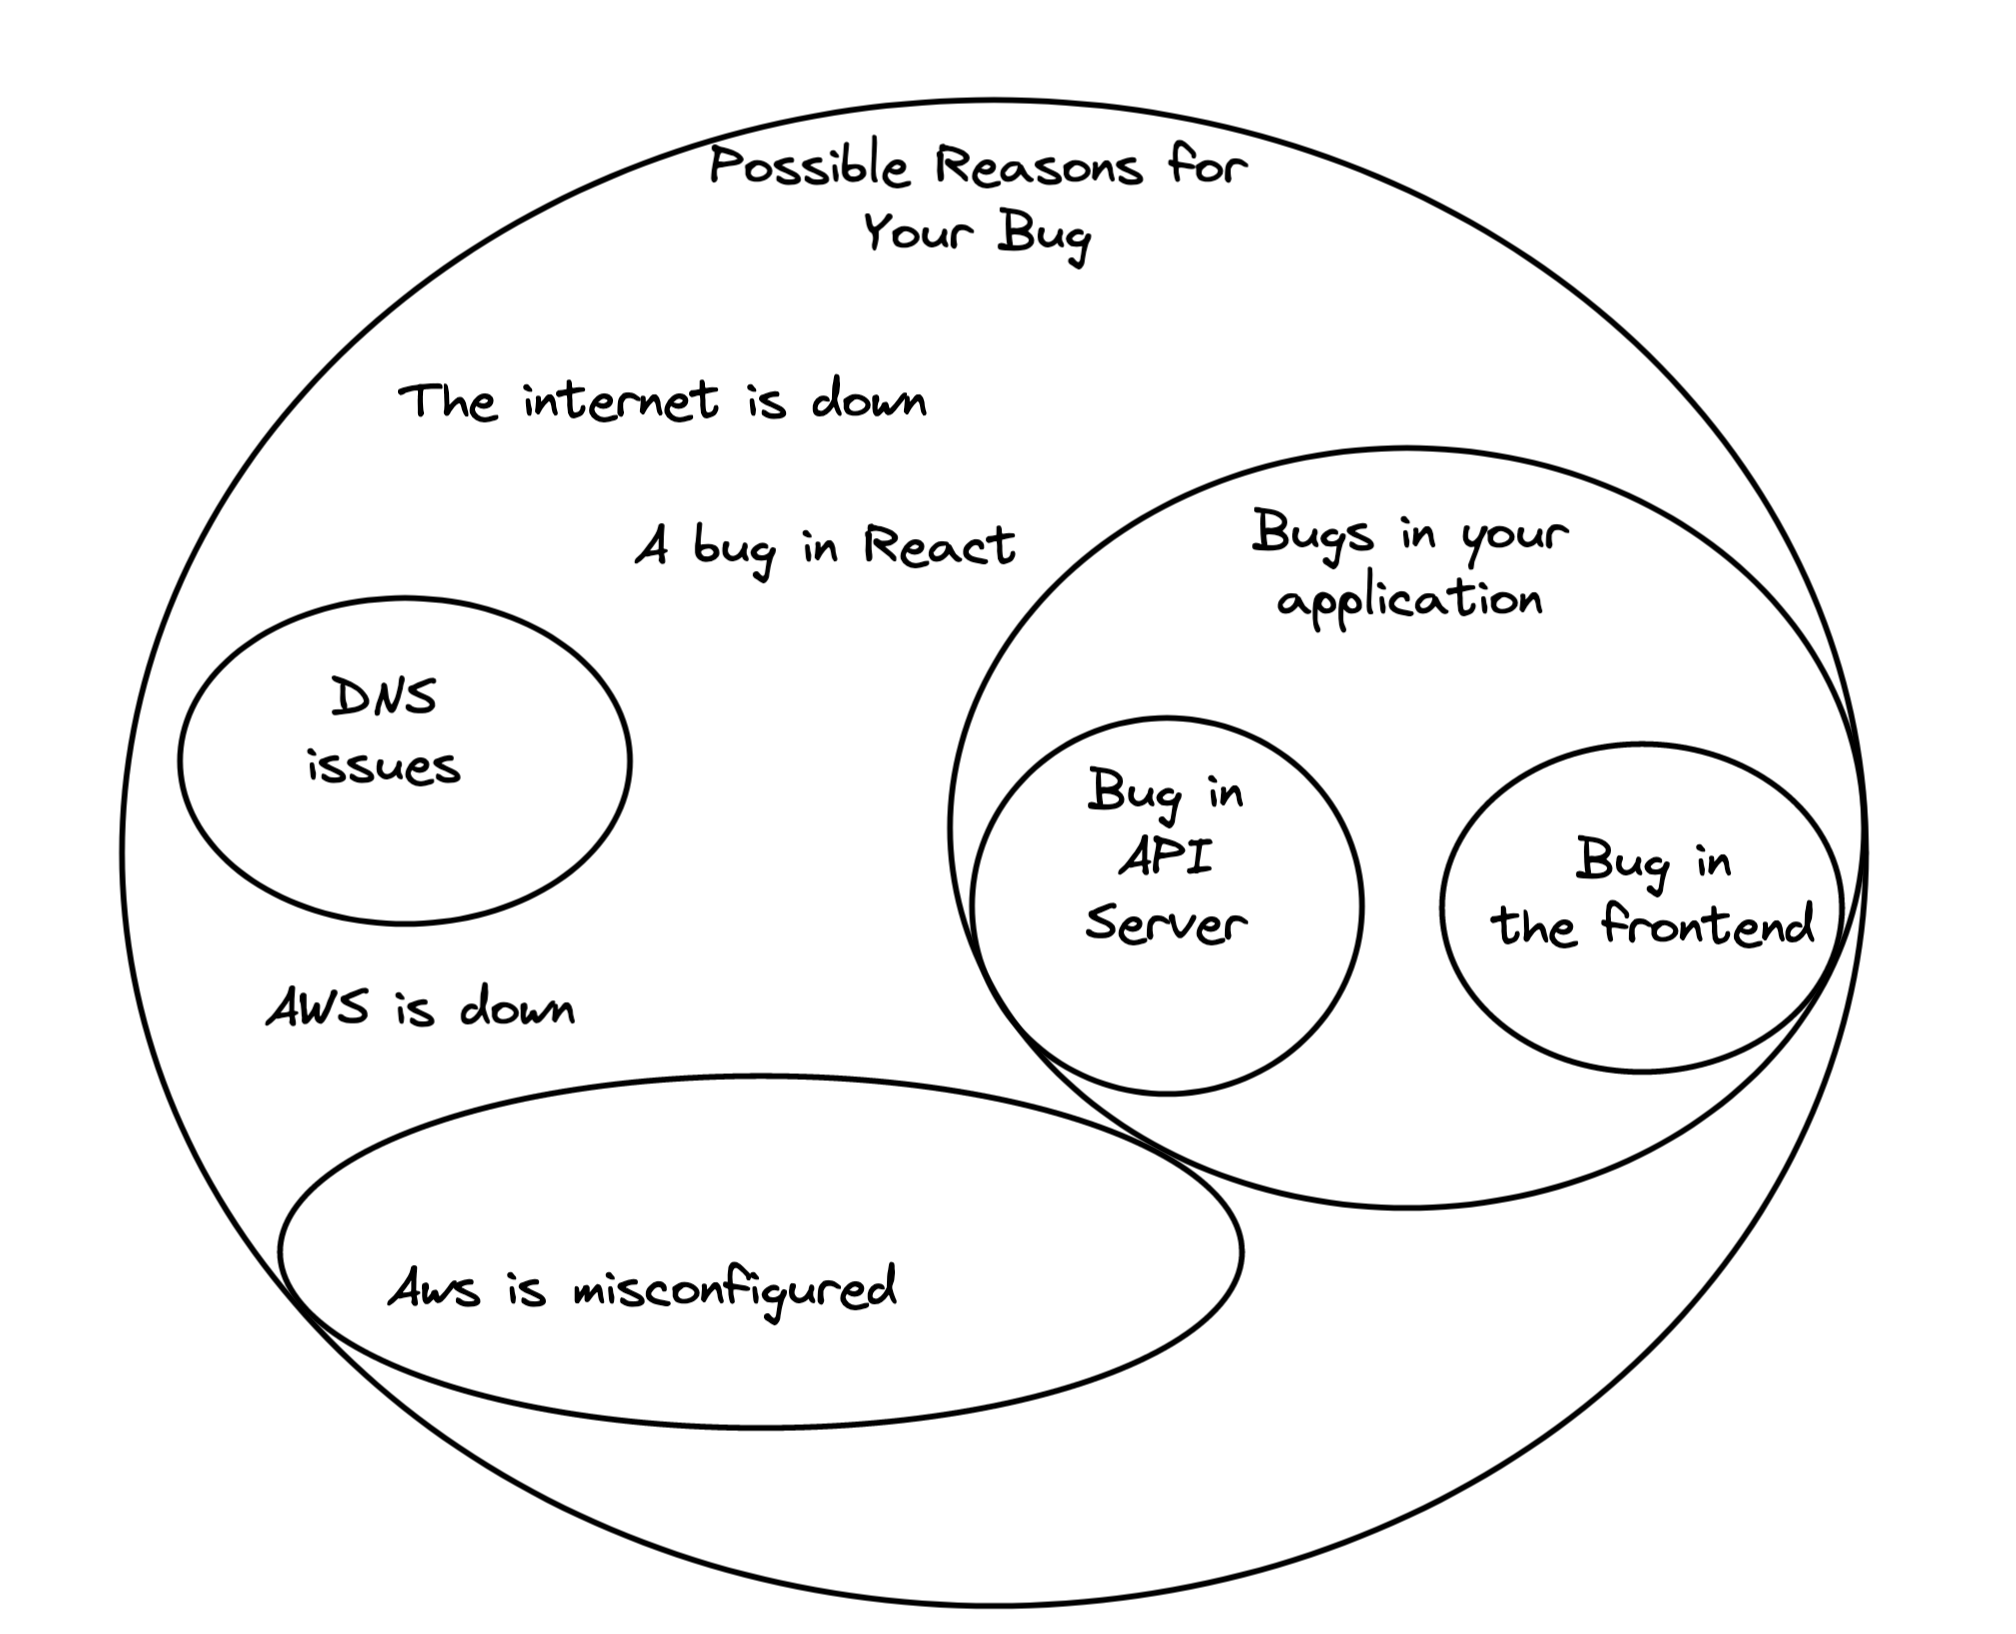
Finding the needle that’s causing our bug is difficult, so we’ll iteratively run “experiments” to narrow down the possibilities. For example we could check that AWS works well internally, and then rule out that set of causes:
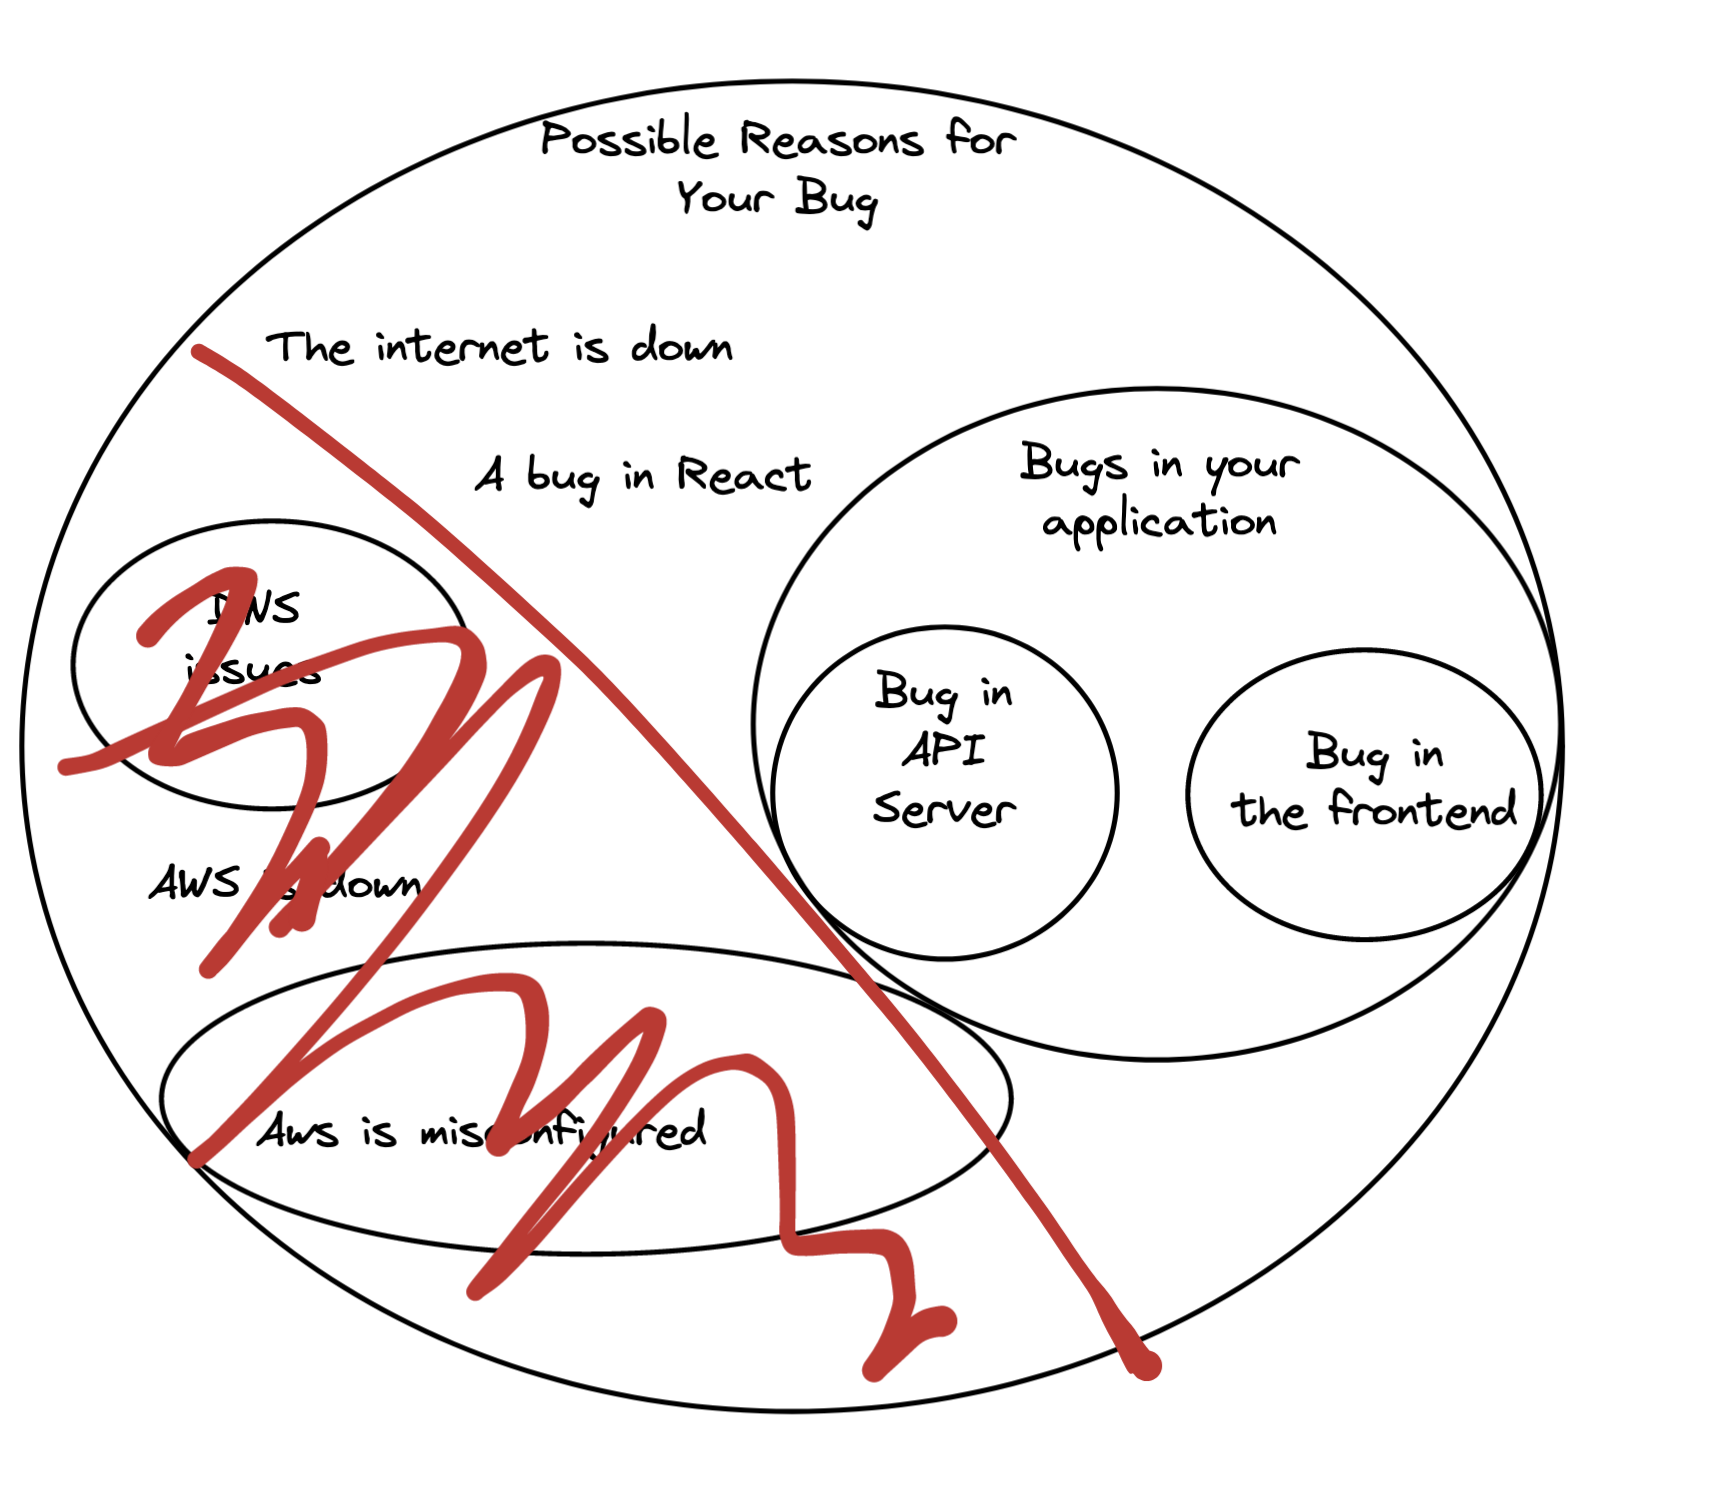
To decide which parts of the space to go after (do we check AWS or the frontend server?), you have to build up a spidey sense of what’s more likely in this picture, and you go after those parts first.
Train Your Internal Bug Barometer
Julia Evans has a post on debugging skills, which I recommend if you are trying to level up your debugging. It ends by quoting a research paper on expert vs novice debuggers:
Their findings did not show a significant difference in the strategies employed by the novices and experts. Experts simply formed more correct hypotheses and were more efficient at finding the fault. The authors suspect that this result is due to the difference in the programming experience between novices and experts.
Experts just picked the likeliest causes more often, and had more experience at debugging tools. This tracks with my experience, where I often “one-shot” bugs at work: the first place I look at is where the bug is, because my hunches are well calibrated.
You can build out this “Bug Barometer” over time by remembering how bugs manifest as you encounter them, and seeking out listings of bugs being solved in the wild and what they looked like. Good places at work are incident reports and on-call logs.
Tighten a Window Around the Bug
Another thing that helps is ruling out entire subsystems at once. If you could rule out the backend or the frontend entirely at the begining of your debugging session, you’d save a lot of time. In an ideal world you’d have a binary elimination process where you eliminate the most likely subtree at each step you take:
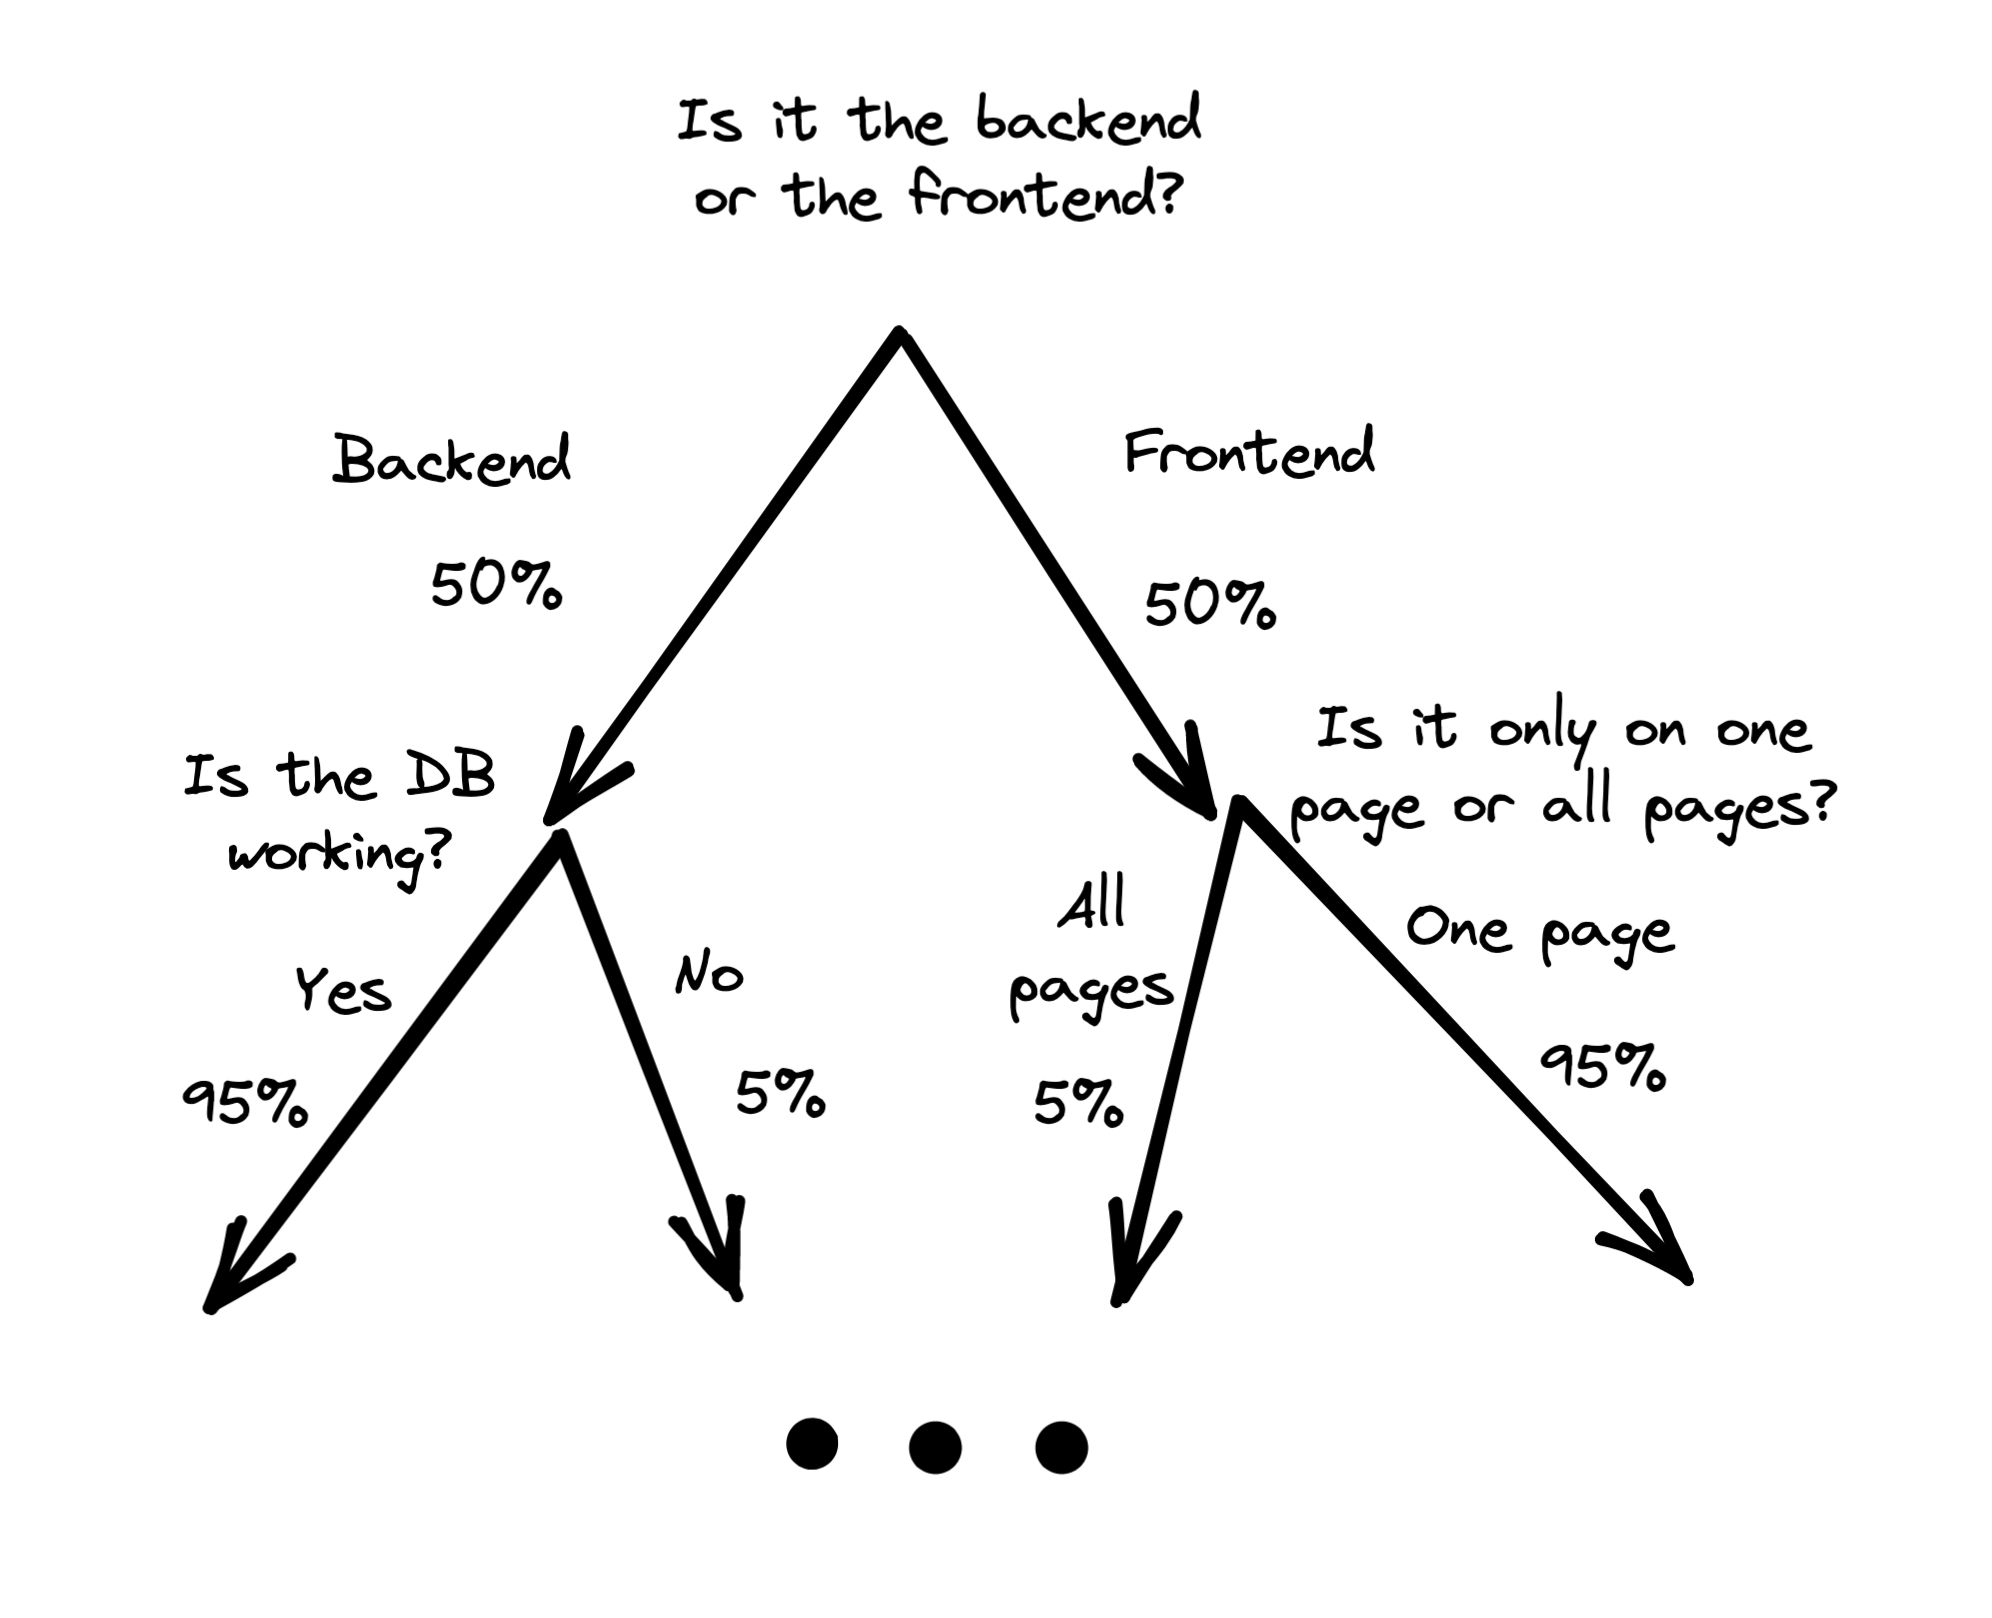
The bad news is there’s no universal decision tree for debugging and there will never be one. The systems are too complicated and change too often. What I do instead is, in my mind’s eye I lay out the golden path of what should be happening in broad strokes:

And then I overlay probabilities of being broken onto each system:
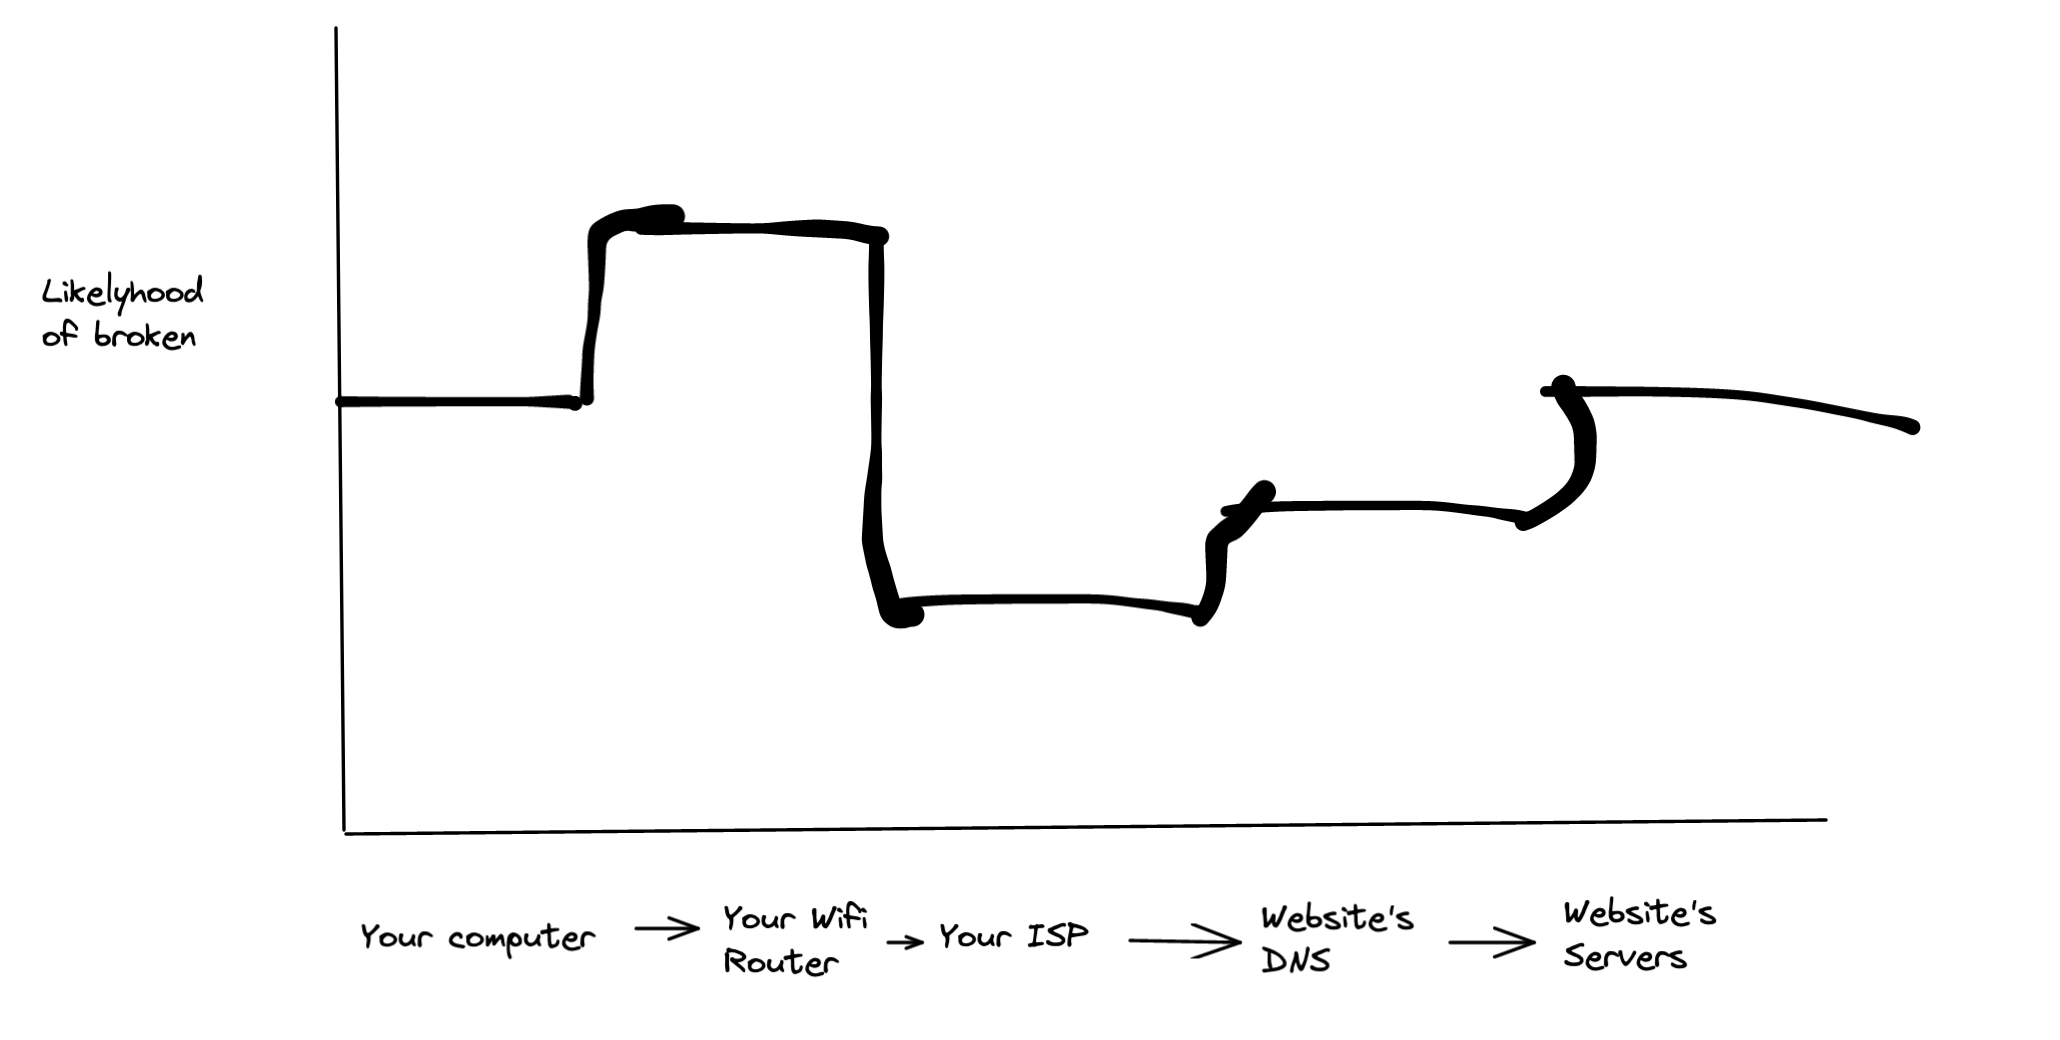
And successively eliminate the likeliest areas, tightening a window around the bug like I’m guessing a number between 1 and 100 with binary search. I zoom in as I rule out more pieces, or if I run out of possibilities.
Isolating + Reproducing: More Than Half the Battle
You don’t have to understand a bug to reproduce it (Emails don’t travel more than 500 miles is a good enough starting point), but you have to be able to reproduce it 2.
The worst types of bugs are on machines you don’t control, and which happen intermittently. Some of these are Heisenbugs, which disappear when you are trying to observe them. (eg hooking up the debugger makes the problem go away!). The only good method I have for dealing with these are trace recording tools, which require the entire execution of the application and let you play it back.
- rr records and plays back entire linux processes. Here is an amazing Postgres developers’ email thread finding a gnarly multi-threaded consistency bug with it.
- Replay.io records the browser and can replay traces with the dev tools and inspect state over the entire lifecycle of the bug, injecting console.logs anywhere in the code.
- Look for similar tools in your domain(maybe distributed tracing tools for microservices, or qemu for embedded), possibly by googling “rr for $DOMAIN”.
If you don’t have these tools available, you’ll have to gather more information from logs and look at multiple instantiations of the bug to find patterns, which will be much slower.
Trace recording tools are still extremely valuable even when you already know how to reproduce a bug, because they free you from having to re-trigger it over and over to intestigate it. As much as possible, use trace recording tools to isolate bugs and experiment on them faster.
Use What You’re Familiar With, but Don’t Get Stuck
Some parts of the system are harder to introspect than others, and we all have varying skill at each of them. For example, I might be really good with lsof but not with dtrace, or printfs instead of GDB. That’s ok, if you only need to know if a particular codepath is being reached printf("here") will do fine.
But don’t get me wrong: it’s very important to learn the debugging tools, and unless your bug is causing downtime/mission critical it’s definitely better in the long-run to go learn the new tool3. That investment will pay off ridiculously fast. I don’t use debuggers that often, but I’m ready to bust them out when I need them. Many people people get stuck because they don’t have the knowledge to open up the right devtool/tracing tool to look at what is going on. I’d go ahead and say if you are stuck on a bug, the first thing to think about should be if there is a better tool, or if you could be looking at a different level of detail.
What if You Run Out of Hypotheses?
This is the toughest part of debugging: when you feel like you’re banging your head against the wall because you’ve run out of ideas. I don’t have any tools here outside of the usual “take a step back and take a break” wisdom.
I will say this happens more often when you are not familiar with the underlying system (the protocols your app uses), or if you’ve taken a wrong turn in your analysis earlier. To try to fix this, revisit your previous experiments and “zoom in” on your causal map of the system.
For a networking example, say your computer can reach en.wikipedia.org but not google.com. Since it can reach Wikipedia, you had had assumed your computer was working fine, so you don’t know what else to do. Zoom in on how your computer makes network connections: it looks up IP addresses in a hosts file, has a cache of DNS answers, sends the router a DNS query, etc. Now you have a list of new places to look.
Conclusion
In the short term:
- Think of yourself as a scientist and to feel better about the bug.
- Use trace recording tools and time travel debuggers to isolate bugs and experiment on them faster.
- Tighten a window around the bug to rule out possible causes faster.
In the medium term, learn introspection tools like dtrace or your browser’s DevTools, and learn the systems your code depends on.
Over time, tune your bug barometer by mentally noting how bugs manifest themselves, and seeking out written reports.
These should accumulate and save you a mountain of time and pain. After implementing these practices, computer programming now feels to me much more like manifesting my creative intent, and less like arguing with a robot.
-
It’s a theory that scientists work by simultaneously navigating a Hypothesis space and an Experiment Space called Dual Space Search. ↩︎
-
You can debug things that already happened, like “the customer shouldn’t have been able to buy anything until their email was confirmed”, but you’re not guaranteed to have sucess there. ↩︎
-
Odds are you will encounter a similar bug in the same subsystem next week, and you will be happy to have learned the proper tool to investigate. ↩︎
comments powered by Disqus
- Patio11's Don't Call Yourself a Programmer, and Other Career Advice
- Forget about localhost:3000 with zoxy
- The 7 Powers in Programming Language Adoption
- Compiling LibPDQ to JS with Emscripten Part 4: Writing Docs & Emitting Typescript
- Compiling LibPDQ to JS with Emscripten Part 3: All in JS → Pushing to NPM