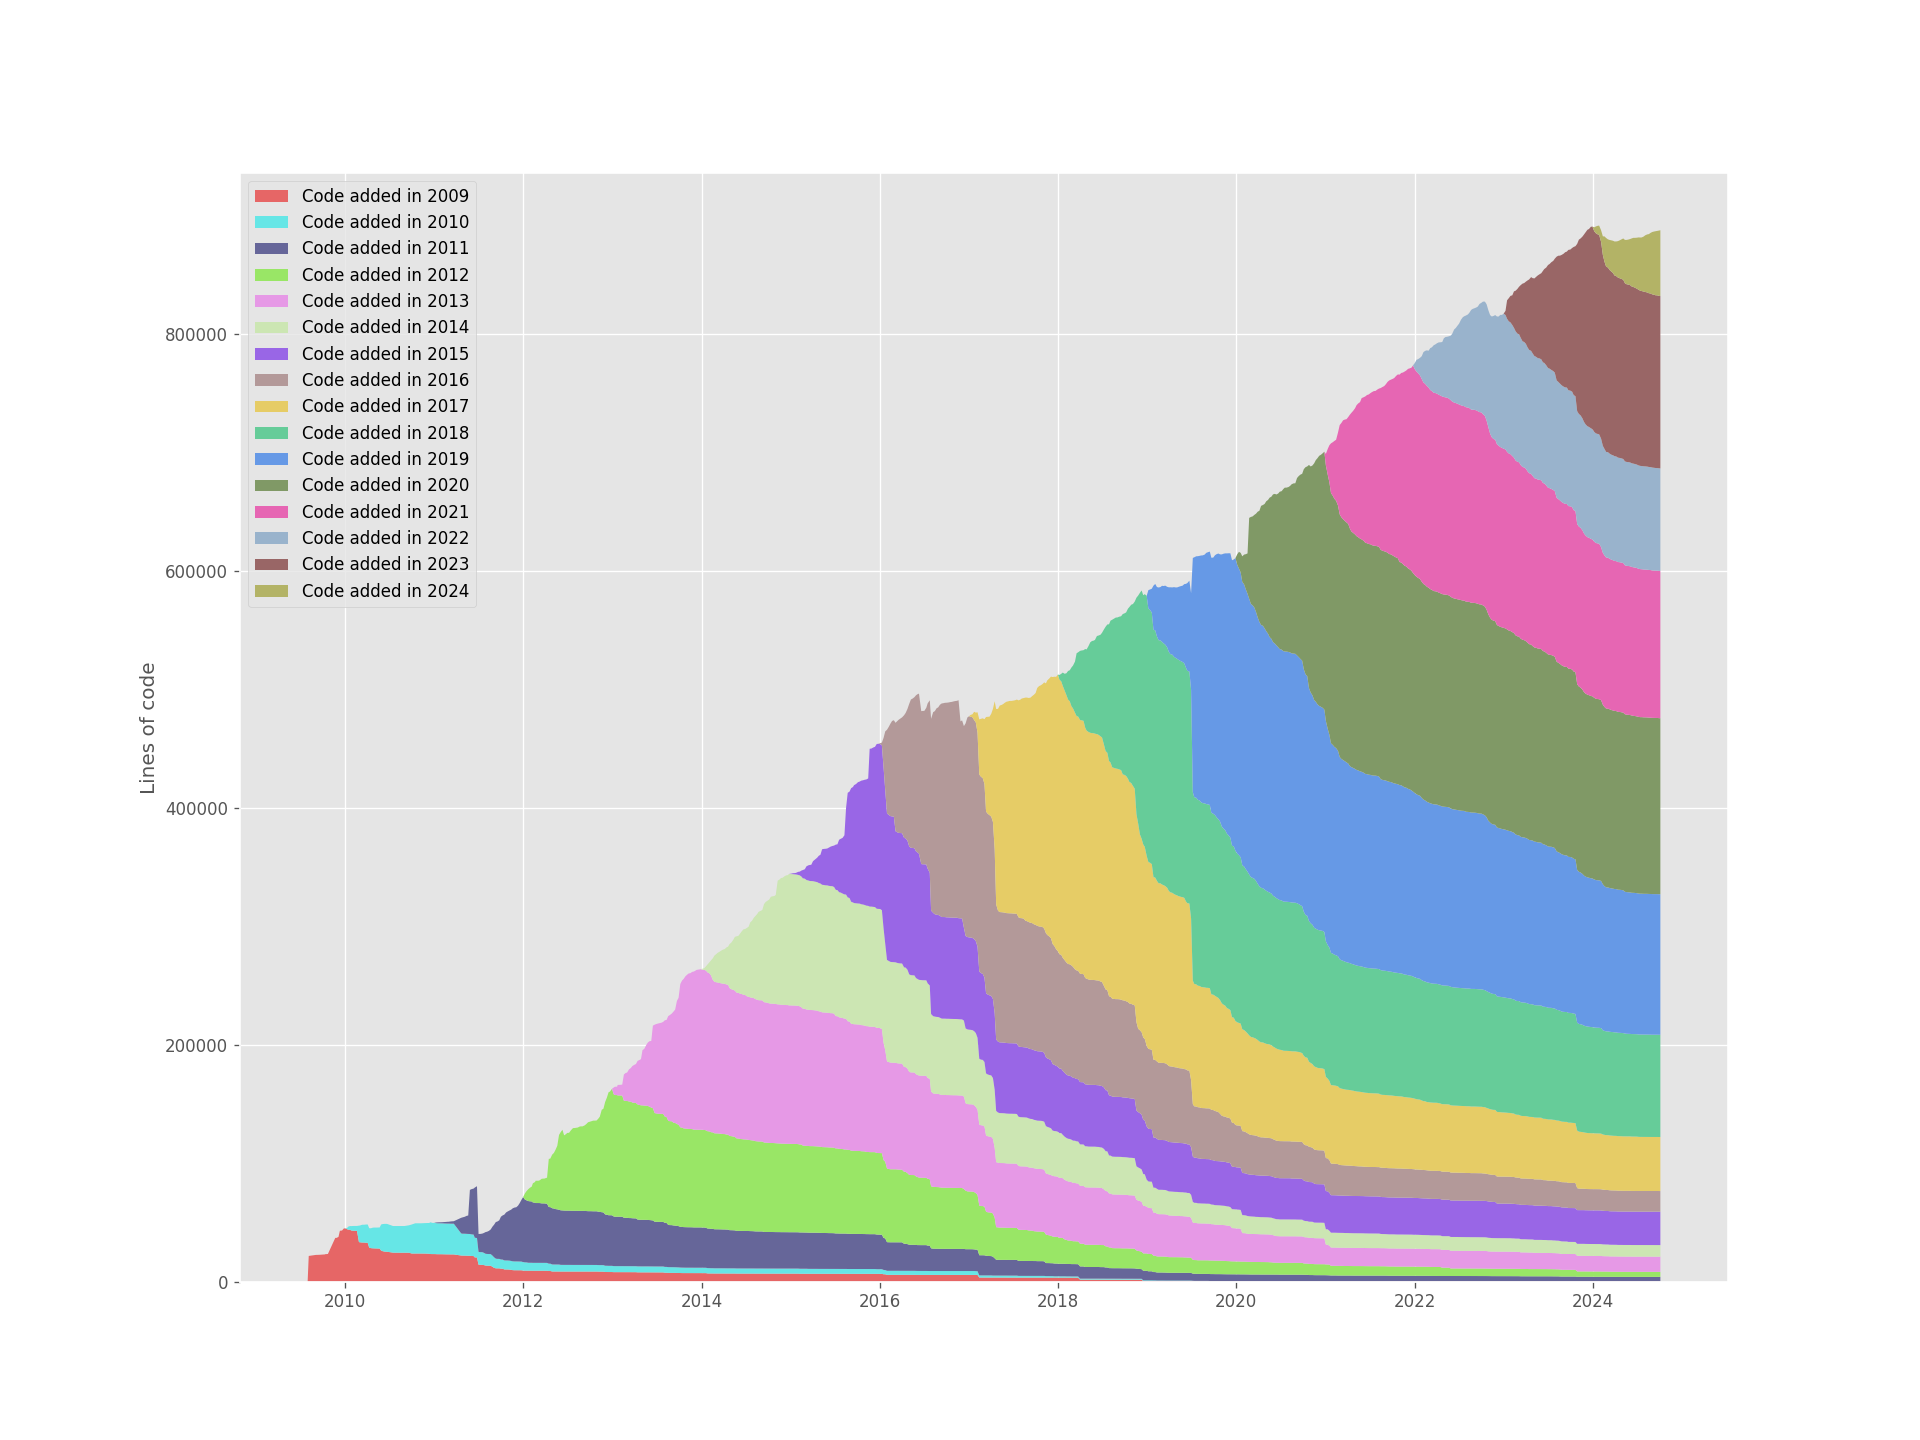
One of my favorite types of graphs of all time is Git of Theseus by Erik Bern, which shows a Git repository’s composition over time. It’s a stacked plot showing, for any given moment in time, the amount of code that was written in each year. It has a really “natural” feel, it looks like layers of sedimentary rock accumulating and weathering over time:
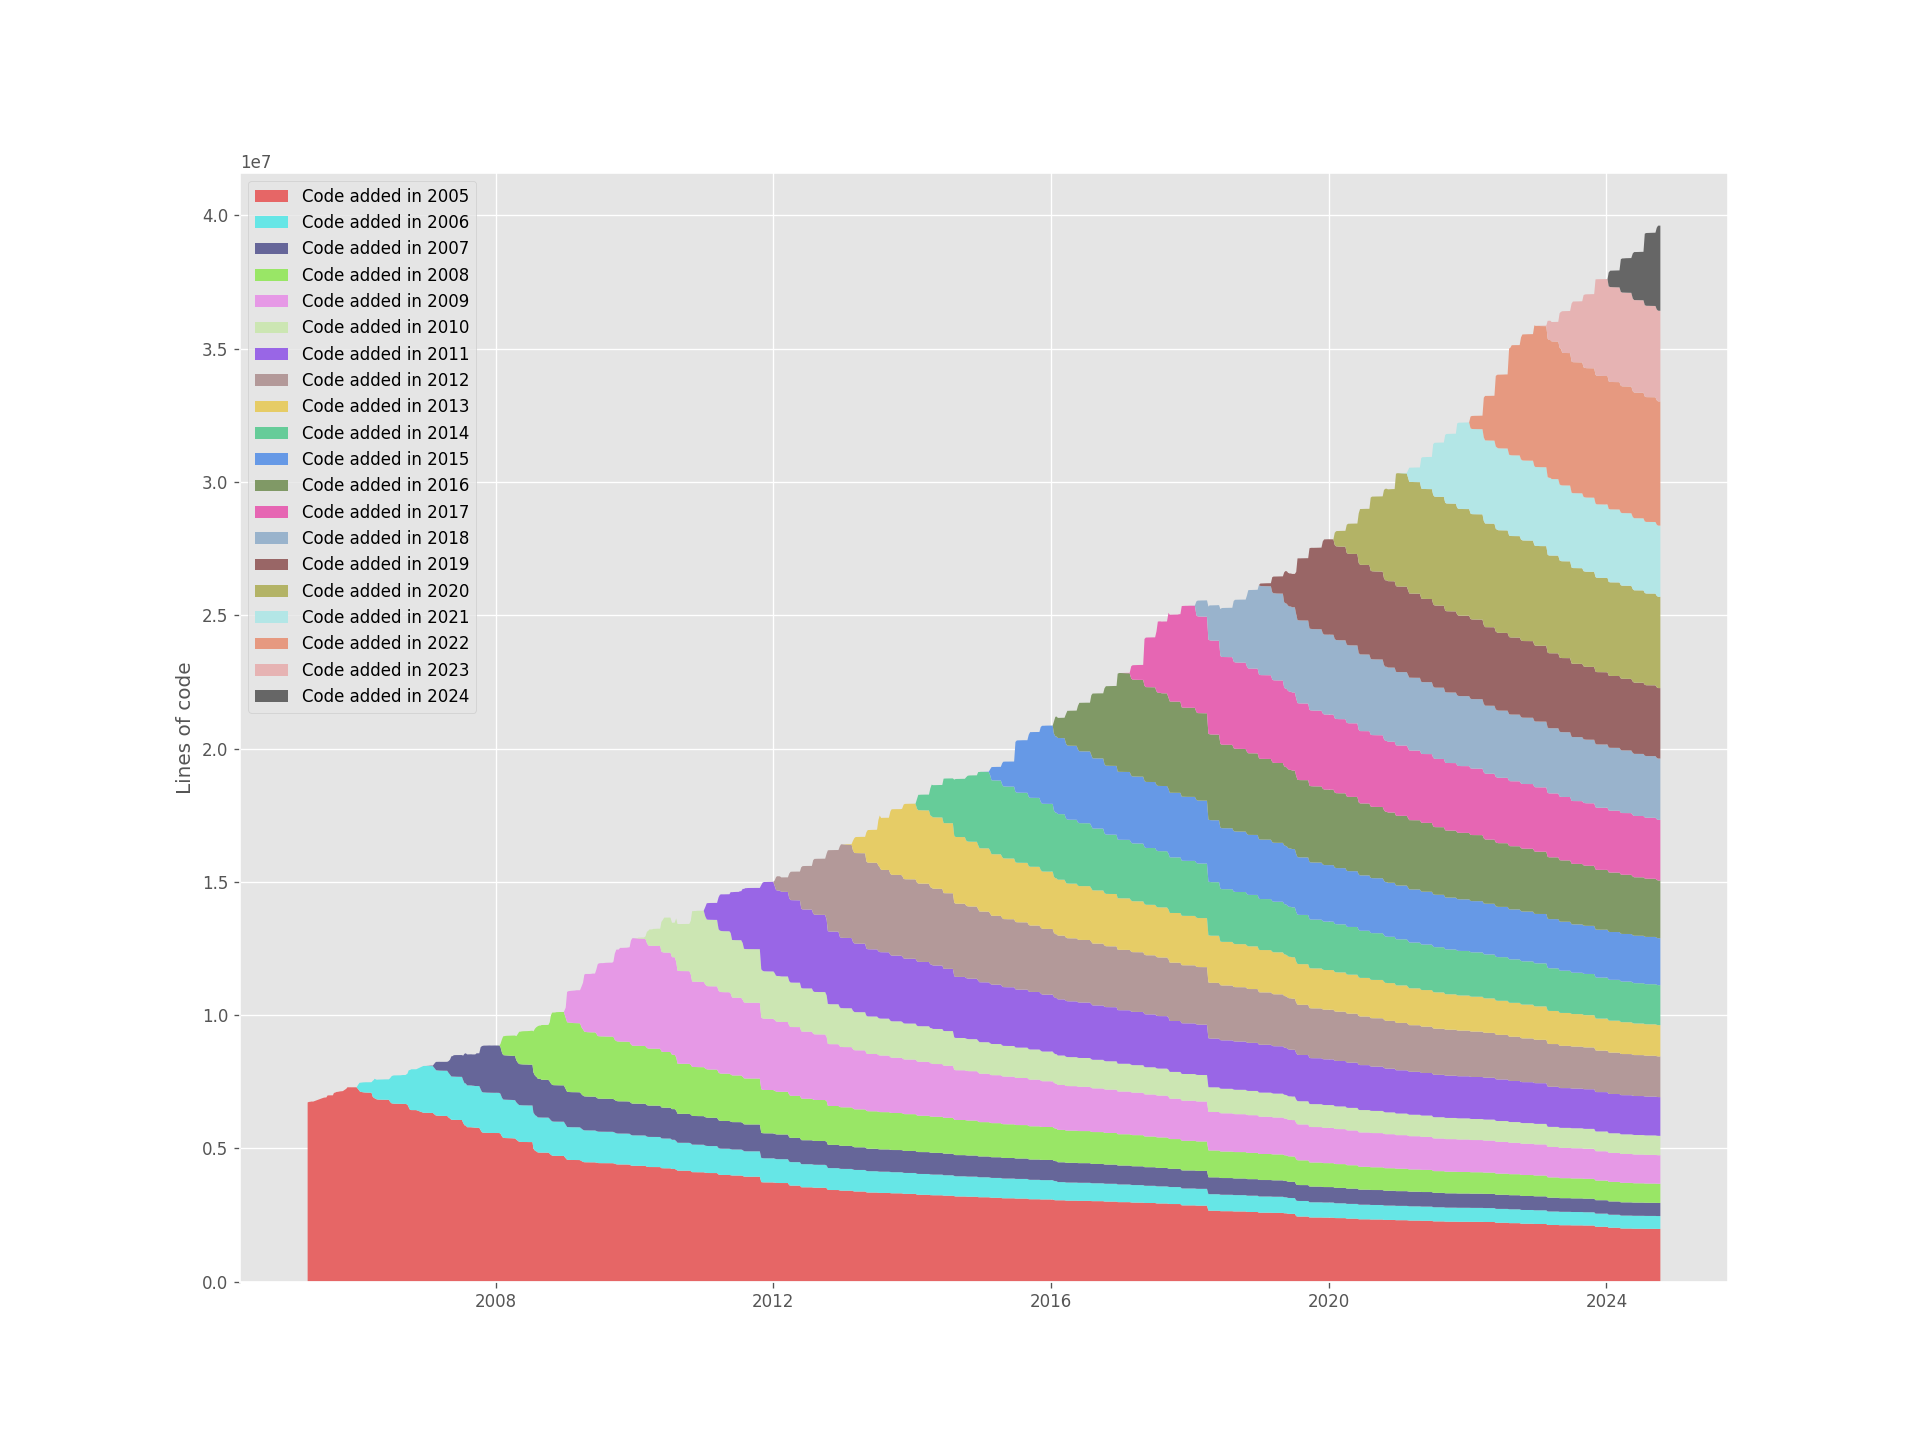
A Theseus stacked plot of the Linux repository
These graphs are beautiful and interesting. But they have a big downside: they take forever to generate 1. It took ~10 hours to make the Linux graph on an M1 Max laptop. While that’s a massive codebase, the point of the tool is to look at large, mature projects and it should be faster than that to be useful. There’s an alternative tool linked in the README called Hercules which is written in Go, but it still takes a whole hour for Linux on my laptop, and it eats up RAM.
So I wrote my own version in Rust using the gix (Gitoxide) crate and called it gix-of-theseus. It’s 500x-1000x faster at making the same graph:
2
| Repo | Git-of-Theseus (python) [s] | gix-of-theseus [s] | Speedup |
|---|---|---|---|
| torvalds/linux | ~36000 | 68 | ~530x |
| git/git | 3011 | 6.2 | 579x |
| ffmpeg/ffmpeg | 8195 | 9.6 | 853x |
| elastic/elasticsearch | 8193 | 9.4 | 871x |
I was surprised how much faster this could go, these numbers look bonkers. While the original tool was written in Python, it uses multiprocessing and shells out most of its work to Git fairly efficiently. How did this get so much faster?
Strictly Fewer Features
It’s not a drop-in replacement; it only makes the one picture. The original can break down the repo by author, draw forgetting curves, and slice the data in many ways. I may add those later, but the goal here is the sedimentary breakdown by year. Collecting the data for these other graphs forces extra work if all you want is the year breakdown.
A Better Algorithm
The time complexity of Git of Theseus is more or less ~quadratic in the number of commits:
it goes through the repo, and for each week, it shells out git blame for every file in the repo at that point in time (only the files that changed since the last commit).
But each independent call to git blame has to go through the entire prior history of that file, so the amount of steps it takes is like adding 1 + 2 + 3 + 4… and getting to O(N²).
Taking inspiration from the aforementioned Hercules, gix-of-theseus implements an “incremental blame”.
It tracks the blame result for each file as it steps through the repo’s history, generating the data in one pass through the repo.
I thought re-implementing git blame would be too hard for a mere mortal like me, but seeing that Hercules did it gave me courage, and I took inspiration from its data structures.
Great Rust Crates
The functionality provided by best-in-class crates like Gitoxide and Rayon is another important reason this tool is fast.
Gitoxide truly is a special library. It’s super fast, has a ton of features and the interfaces are pretty coherent together. As an example of its superpowers, it can use Rayon to parallelize its own operations, and when unpacking compressed Git data it has access to zlib-rs, the fastest existing zlib library. It’s genuinely a shining star of the Rust ecosystem.
Try it out!
Install with cargo install gix-of-theseus, then run:
gix-of-theseus analyze $your_repo_path
To generate the plot. If you have uv or pipx installed (you can get either through pip install), the analyze command will auto-generate a plot and save it to $outdir/stackplot.png. The original python plotting scripts have been lifted and modernized into PEP 723 “self-contained scripts” that auto-install their dependencies and don’t require you to think about virtualenvs.
If you try it, I’d love to see your graph ((@amedee.me)[https://bsky.app/profile/amedee.me] on Bluesky)!
You can also check out the code and give feedback on my intermediate Rust.
Next up: putting a small web UI on this so it can be online!
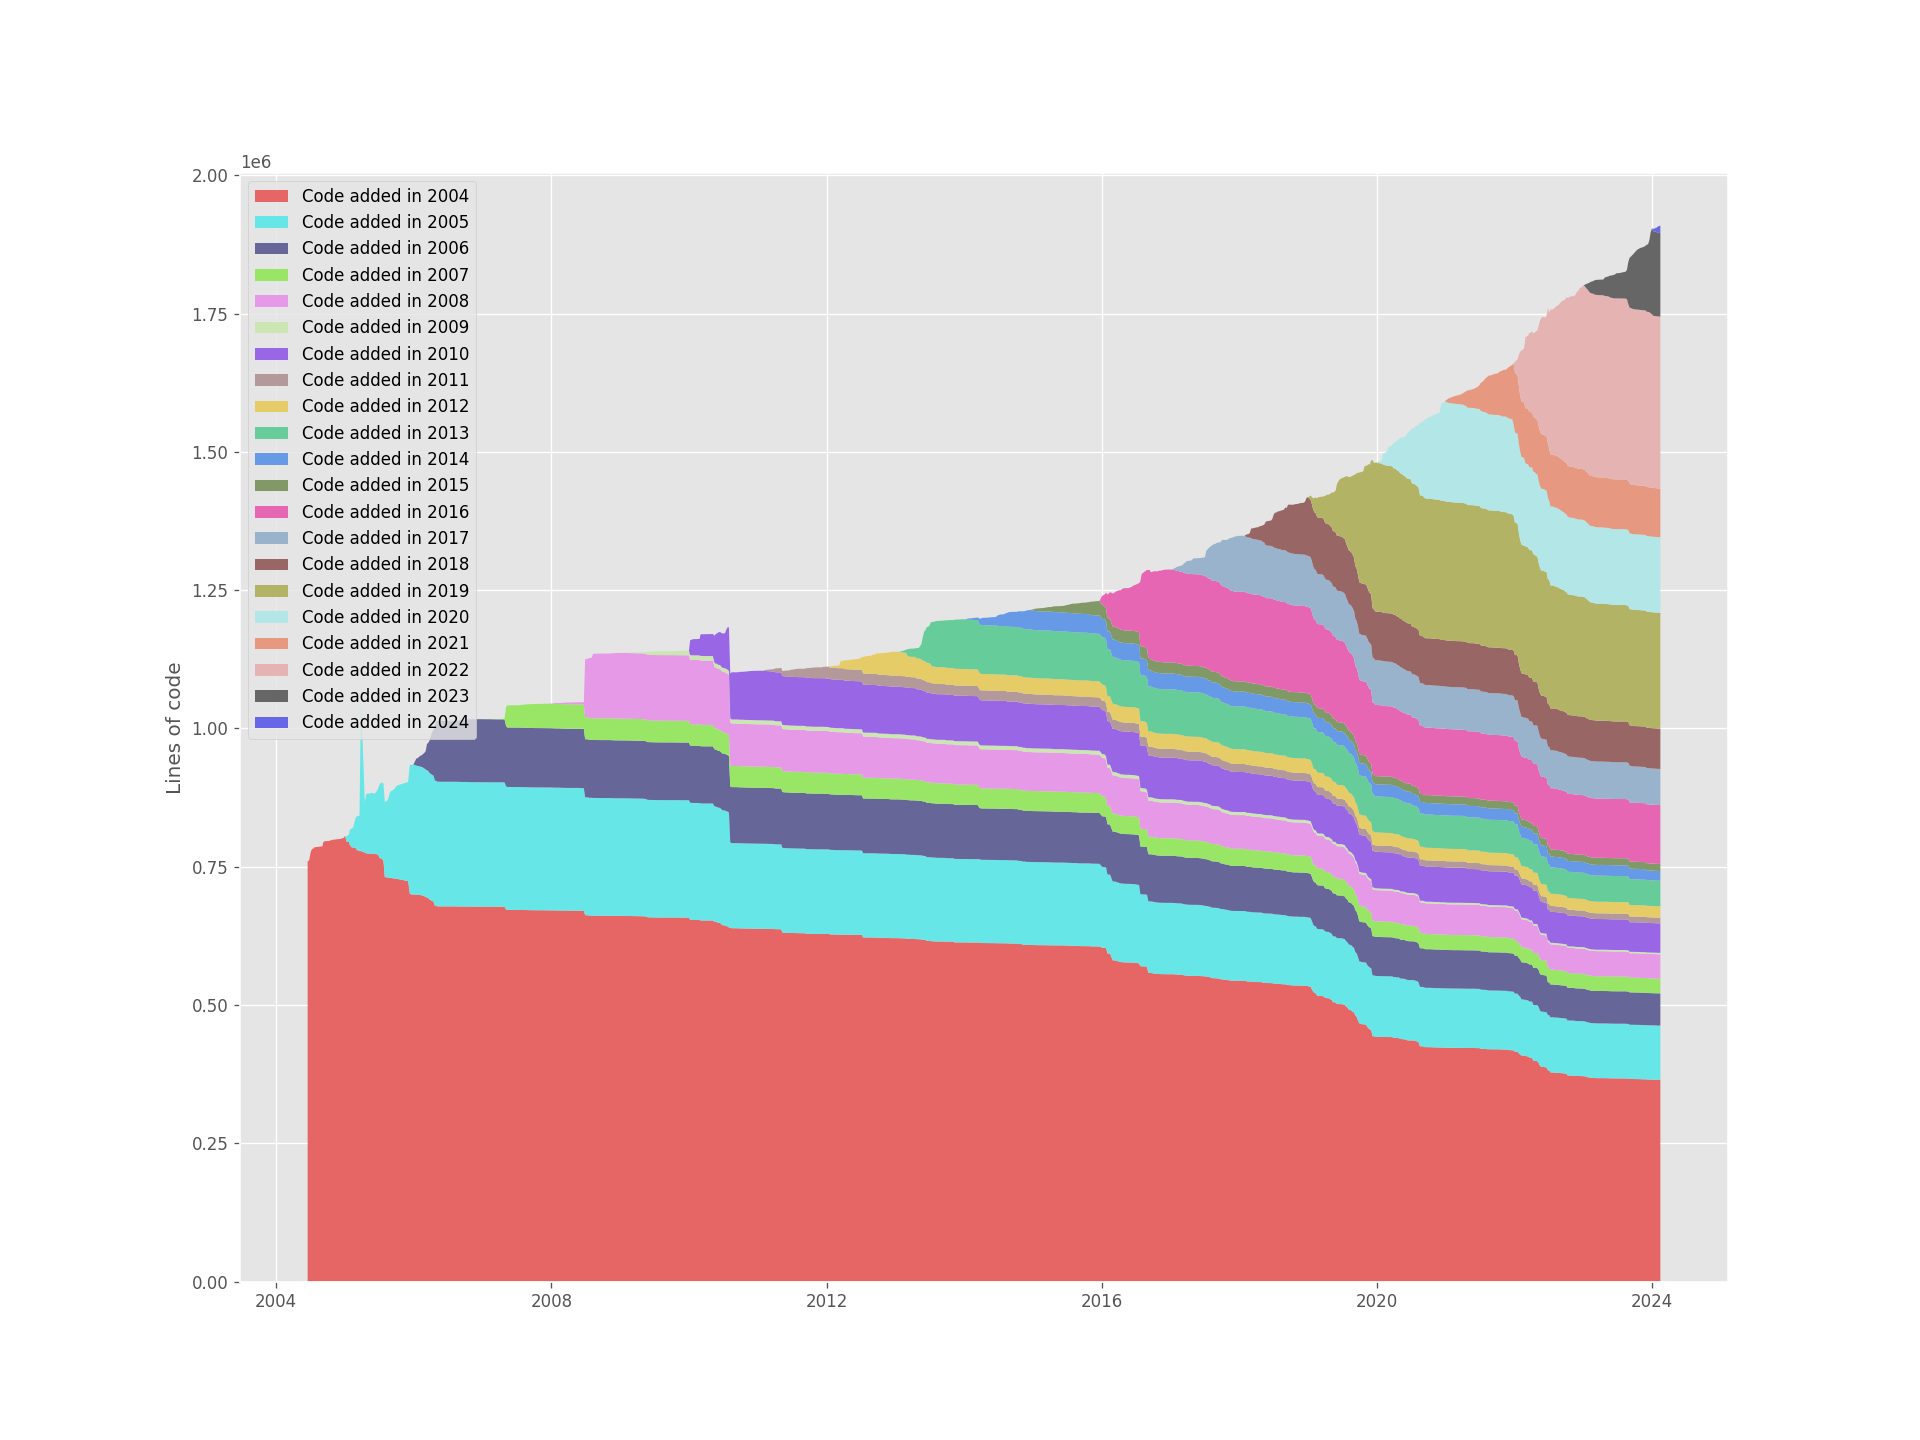
Appendix: A Few Pictures for Fun
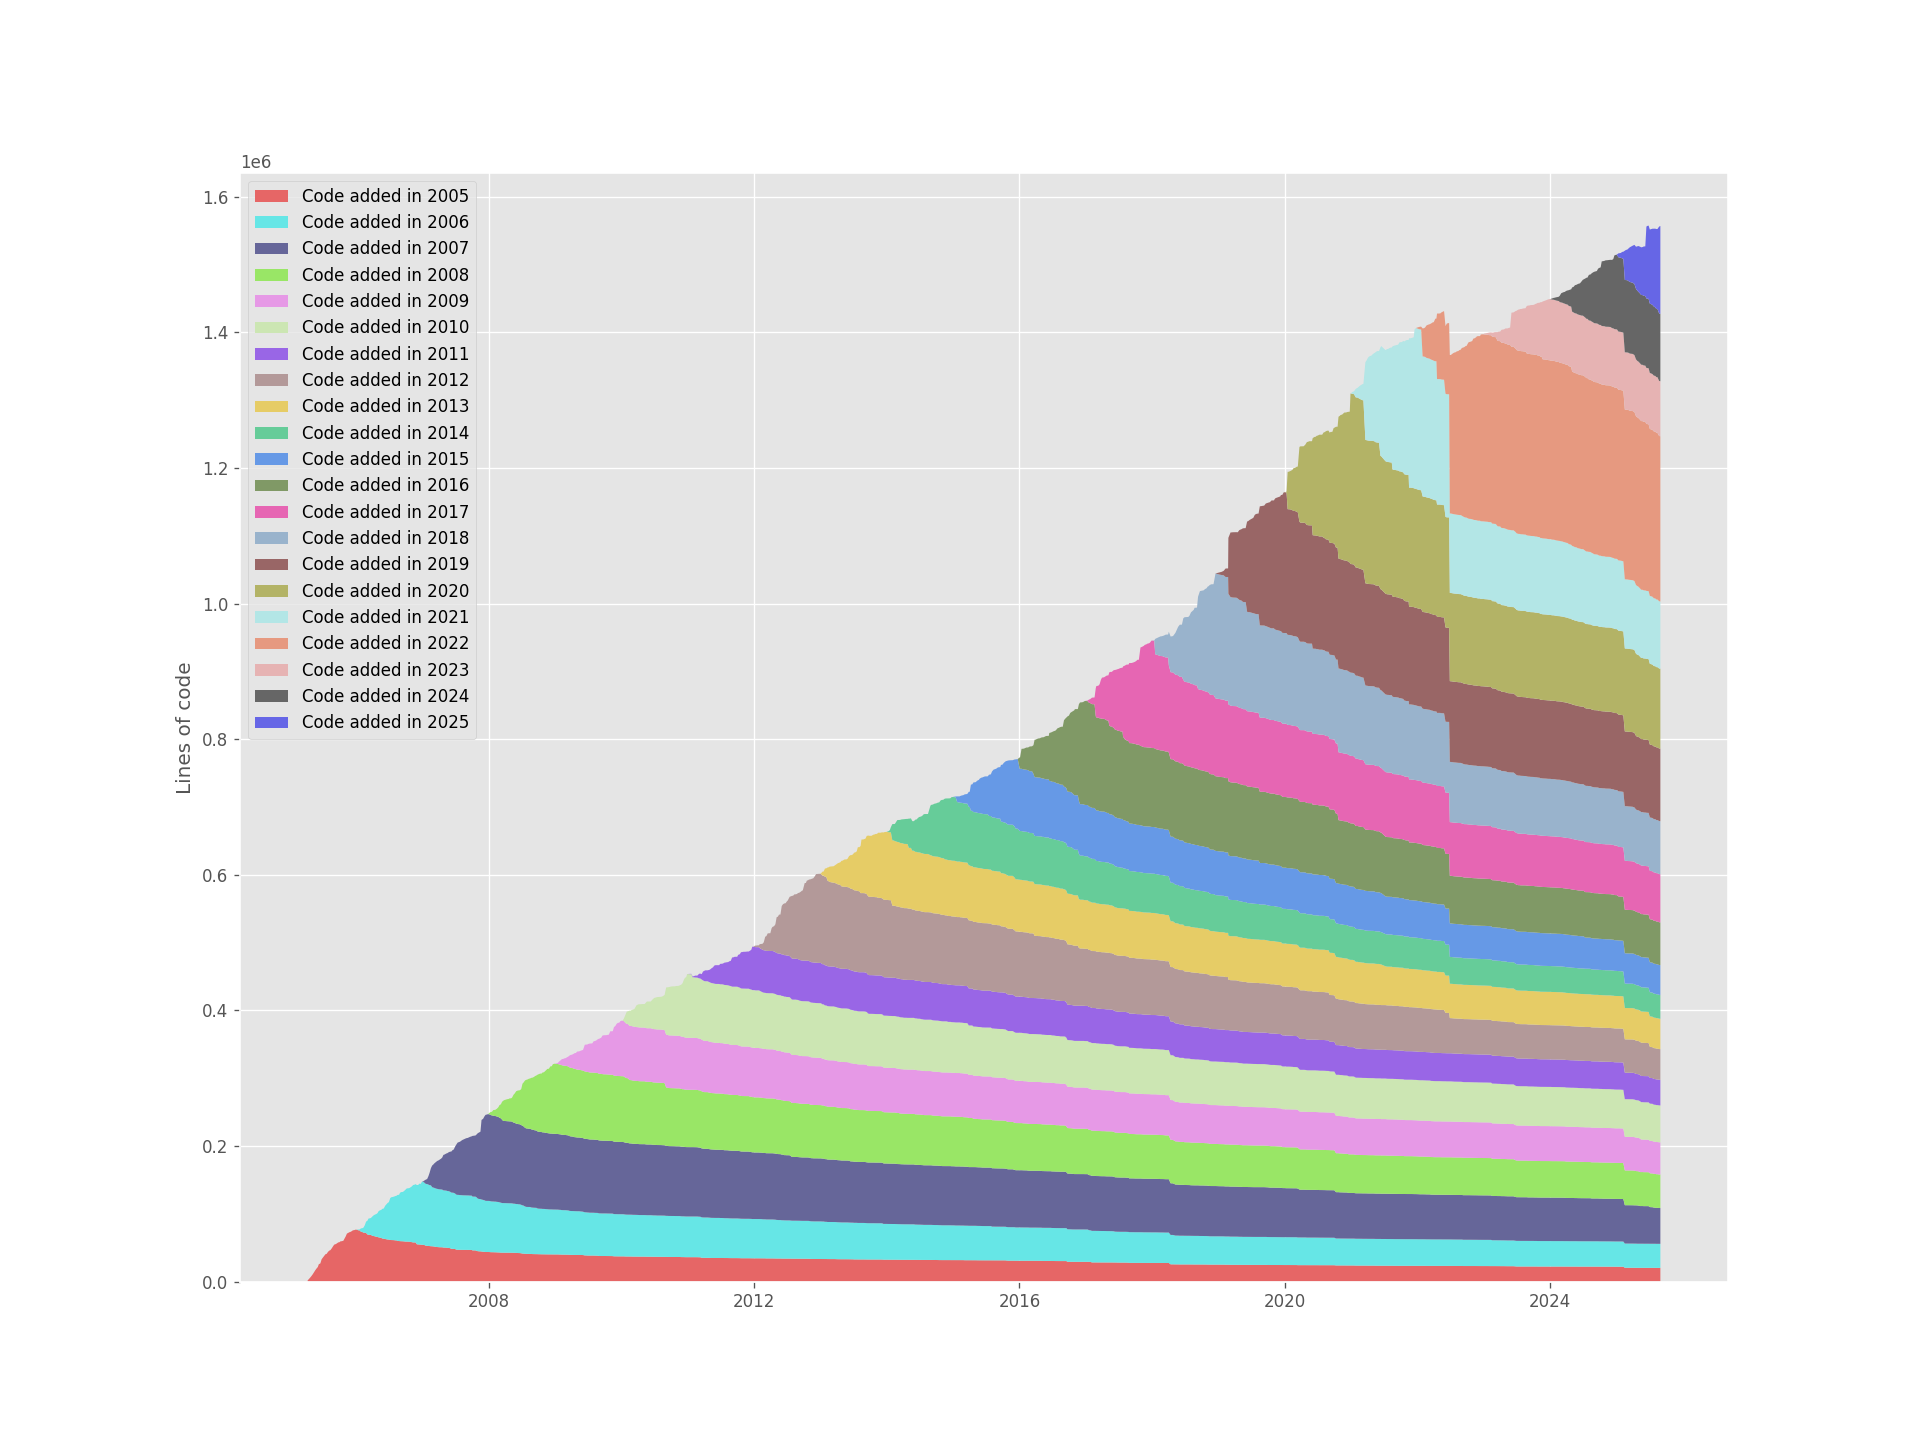
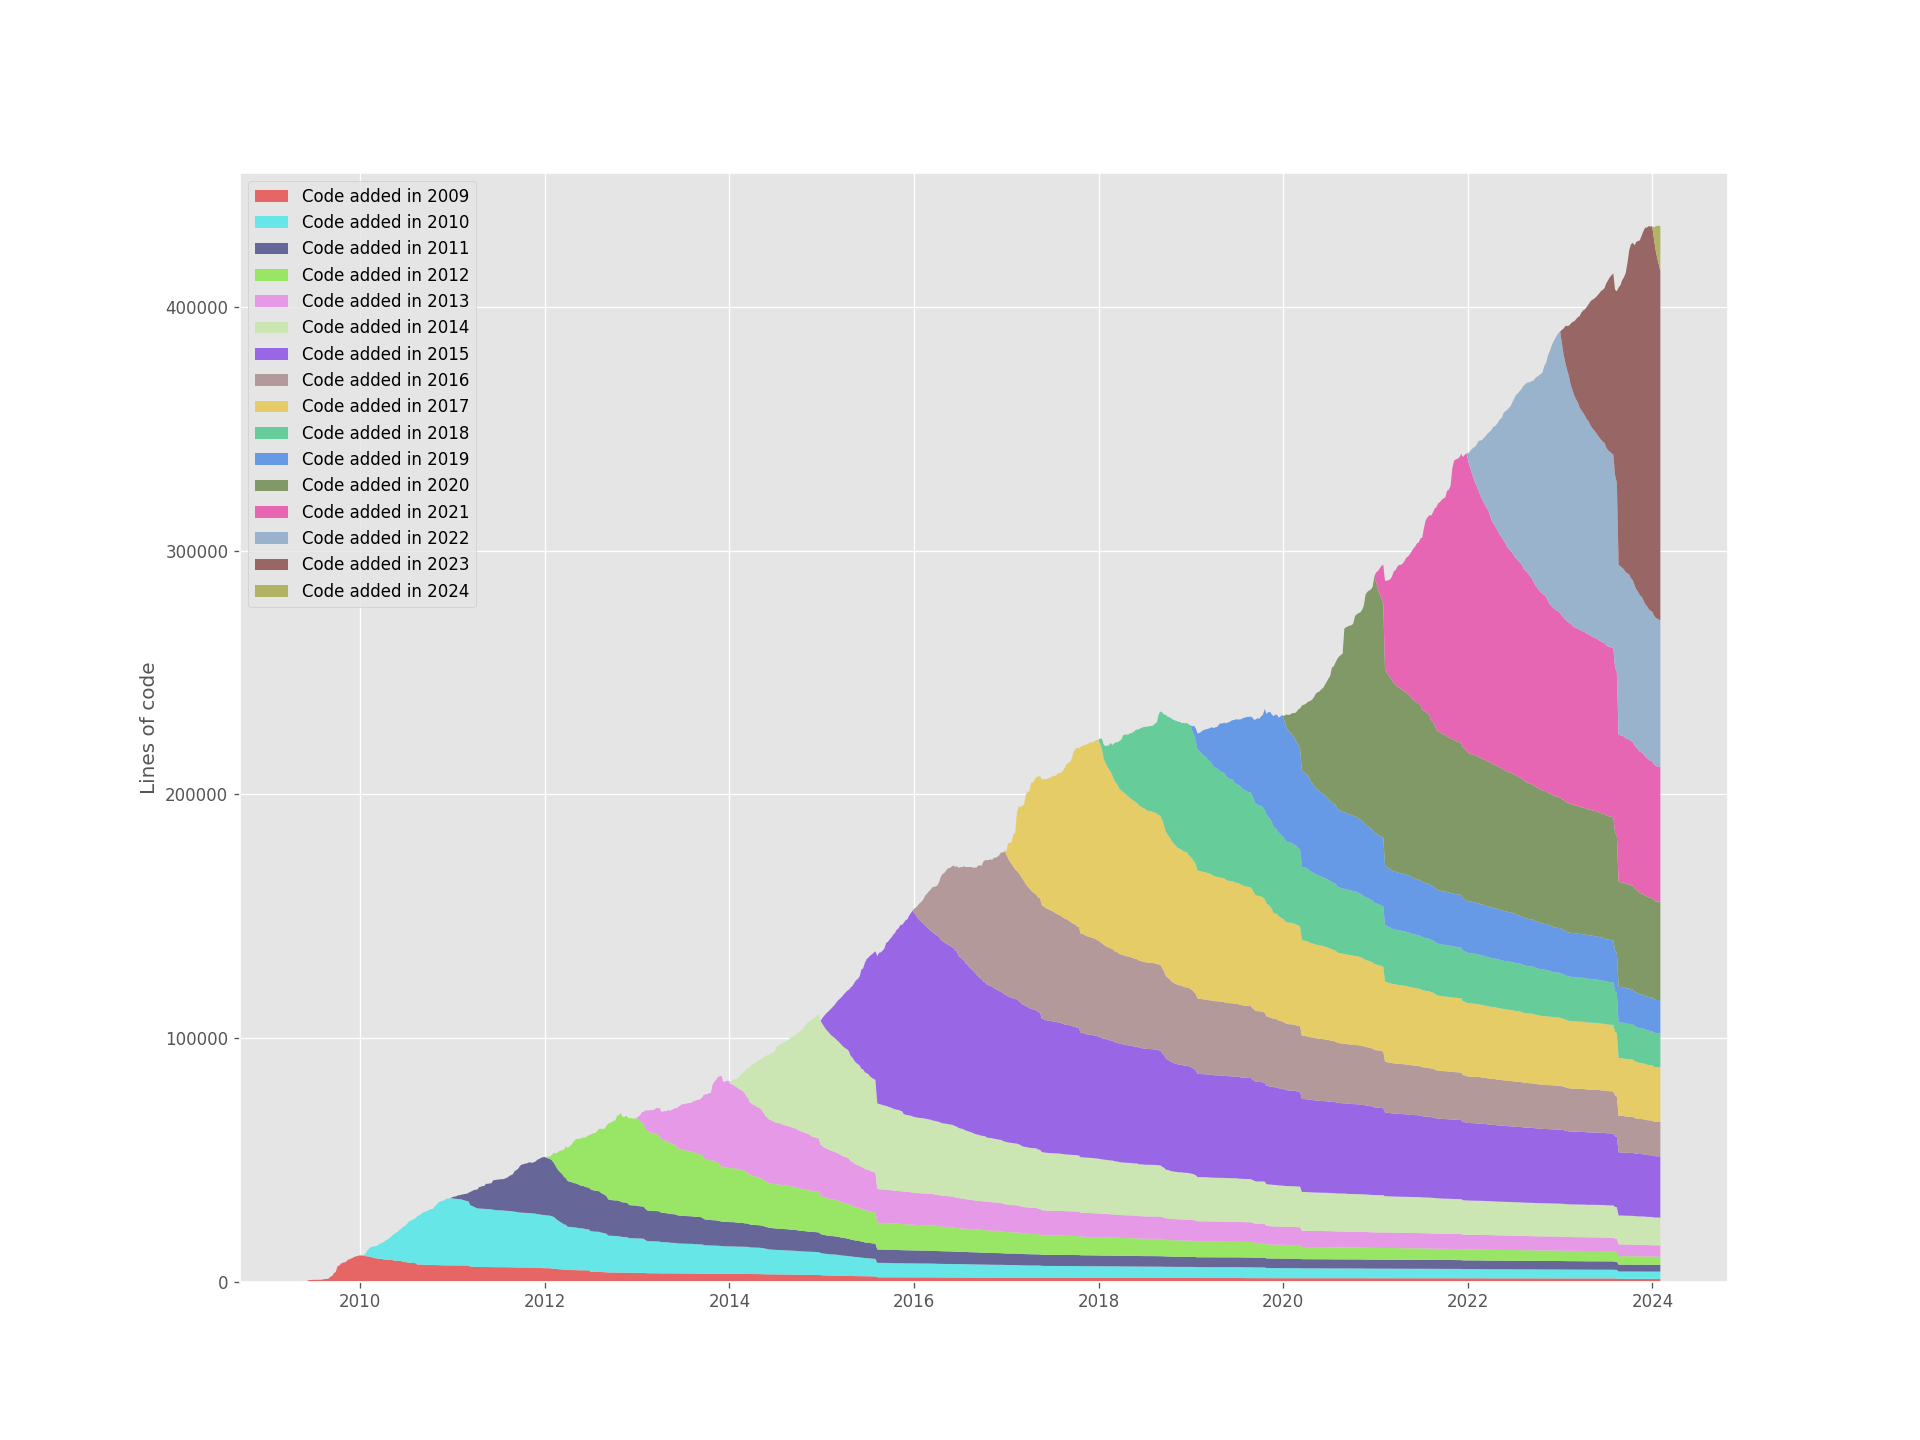
Git (6s to generate)
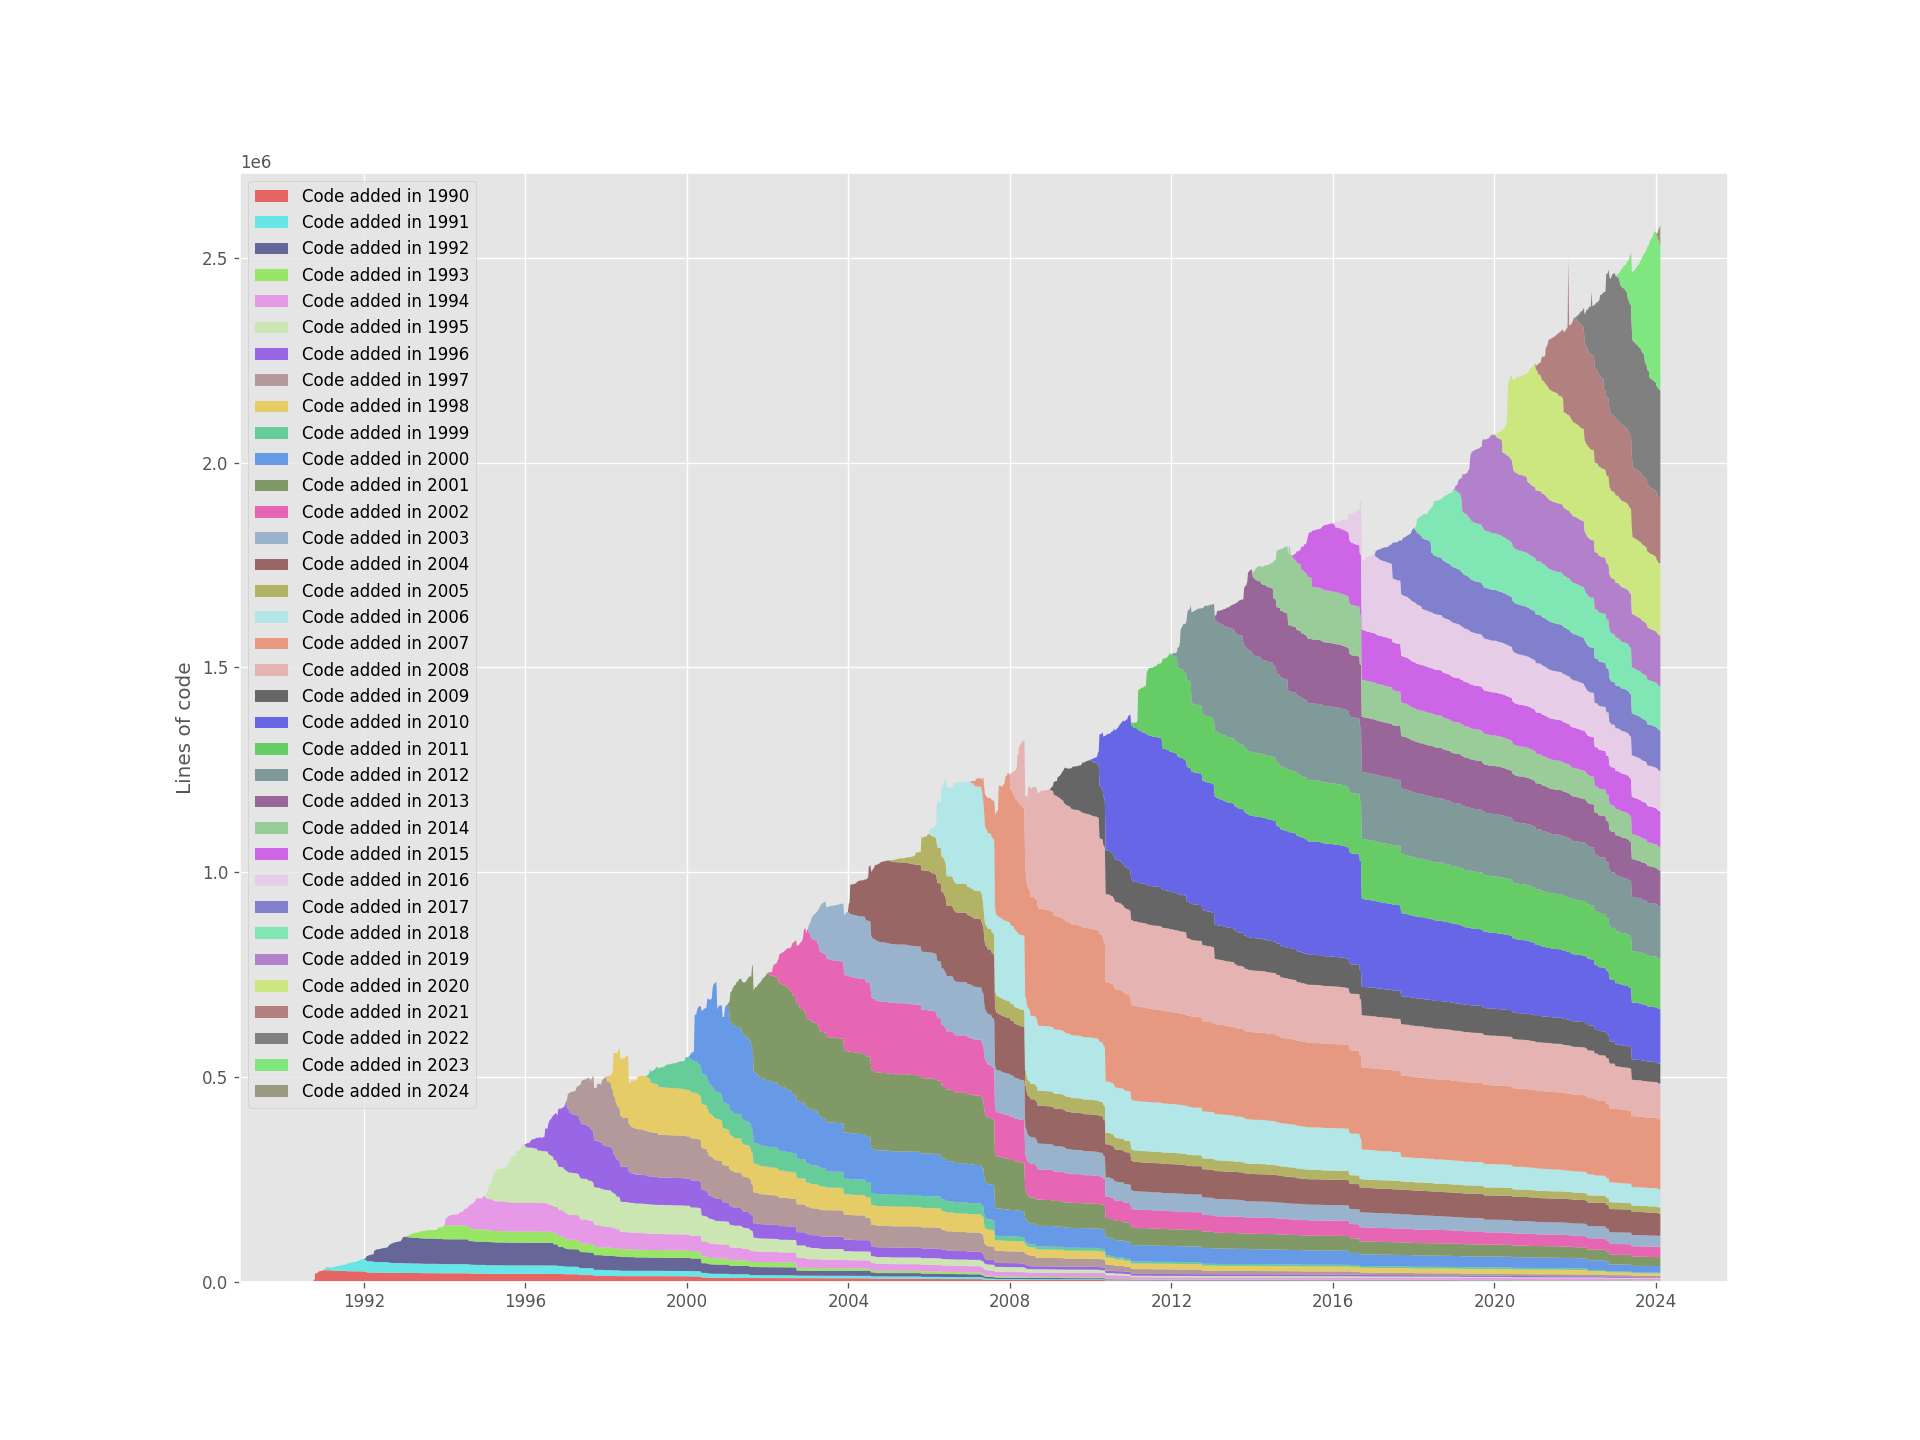
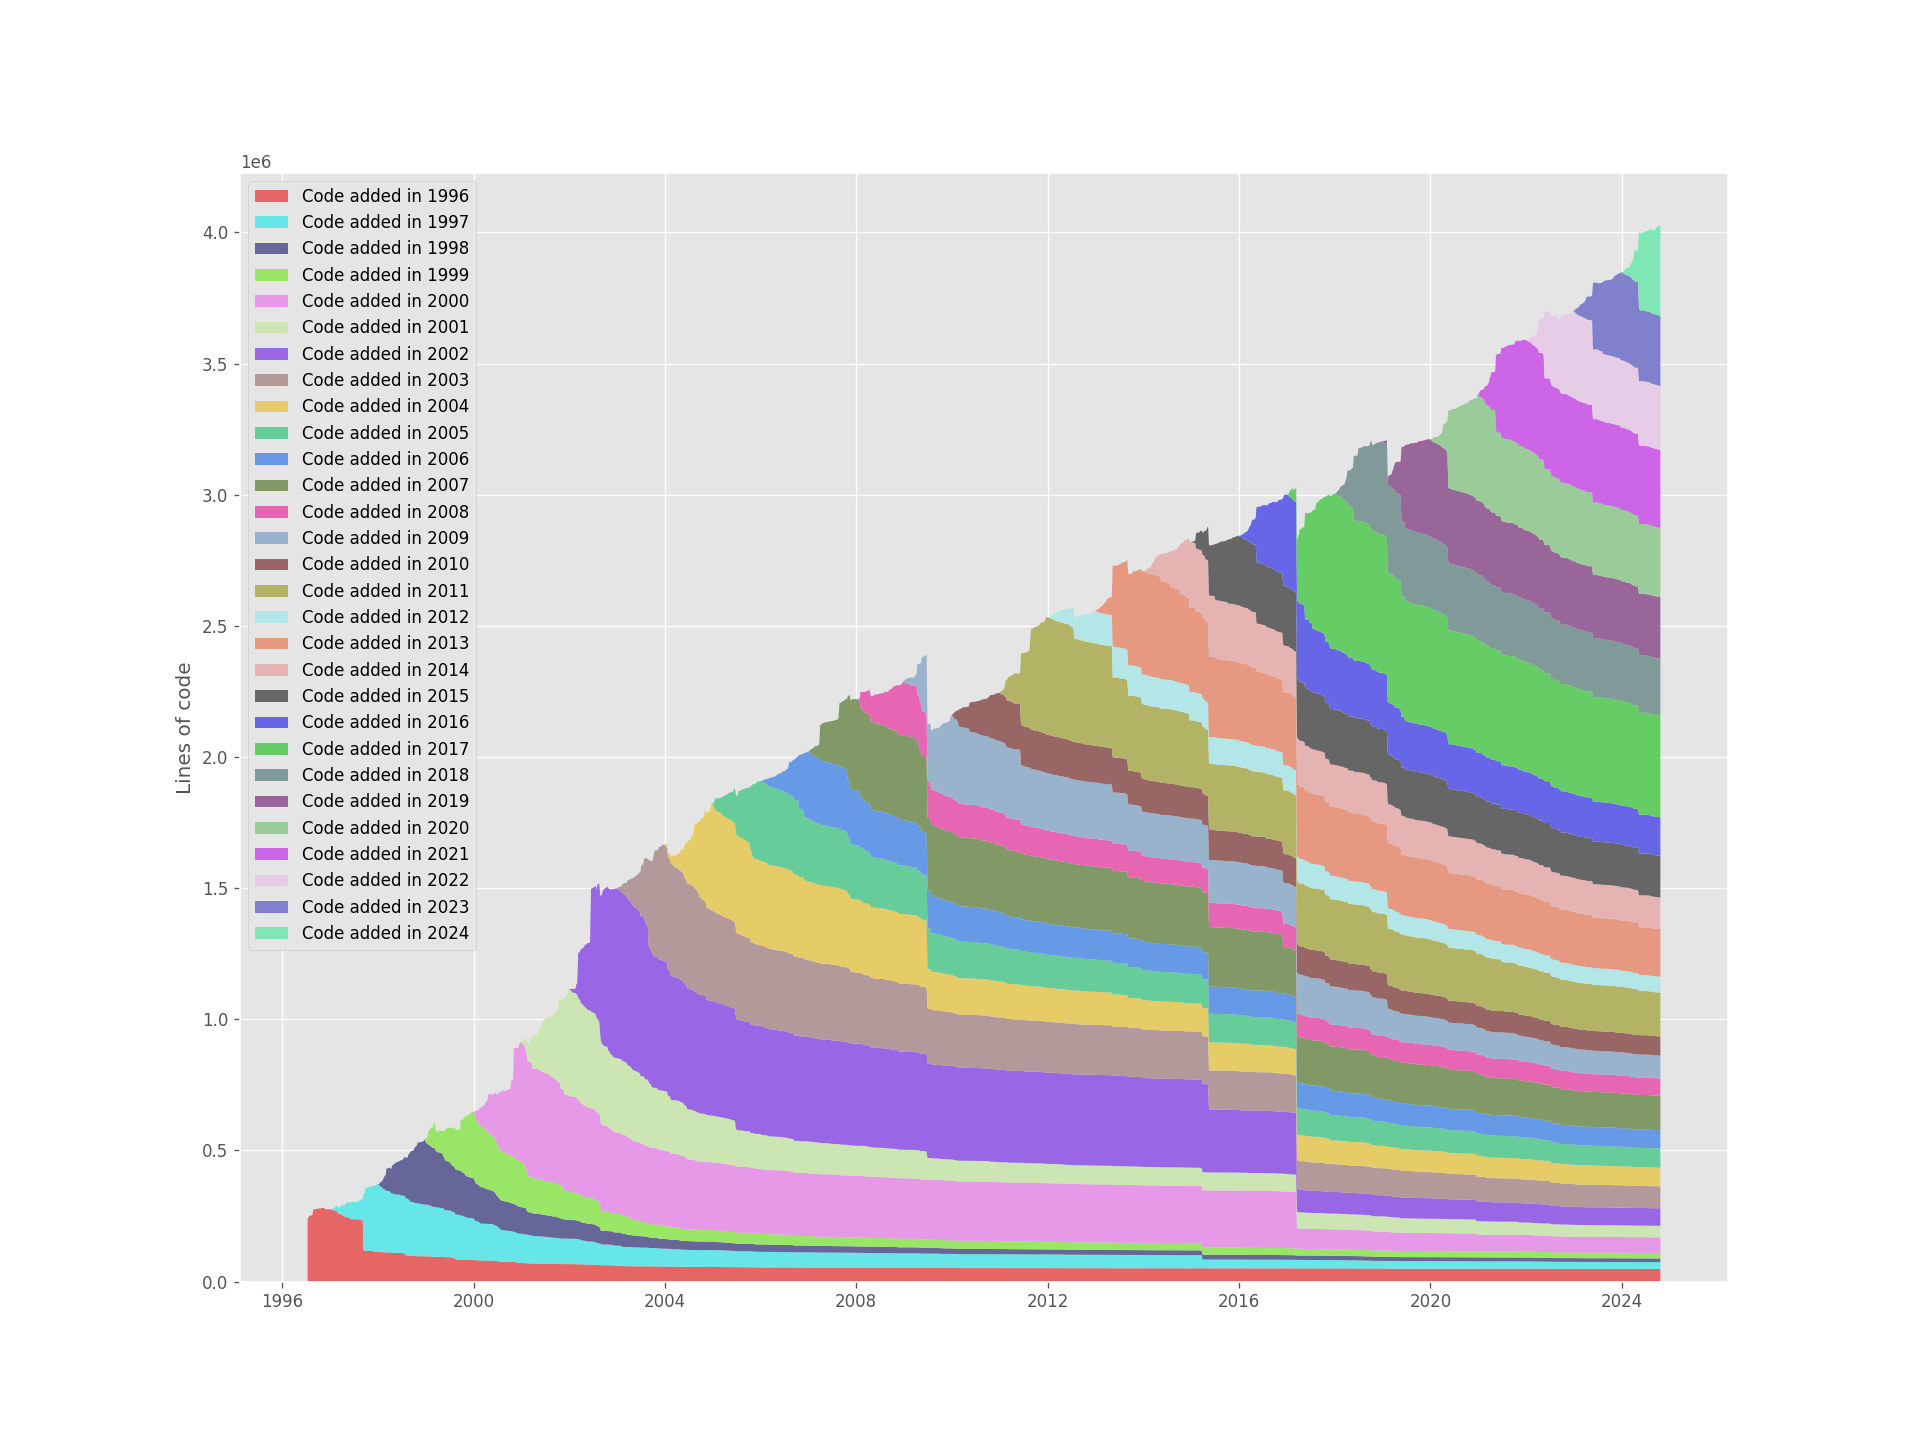
The CPython interpreter (15s to generate)
Vim (9s to generate)

Rust (13s to generate)
Pandas (6s to generate)
The packages in homebrew-core (8.3s to generate)
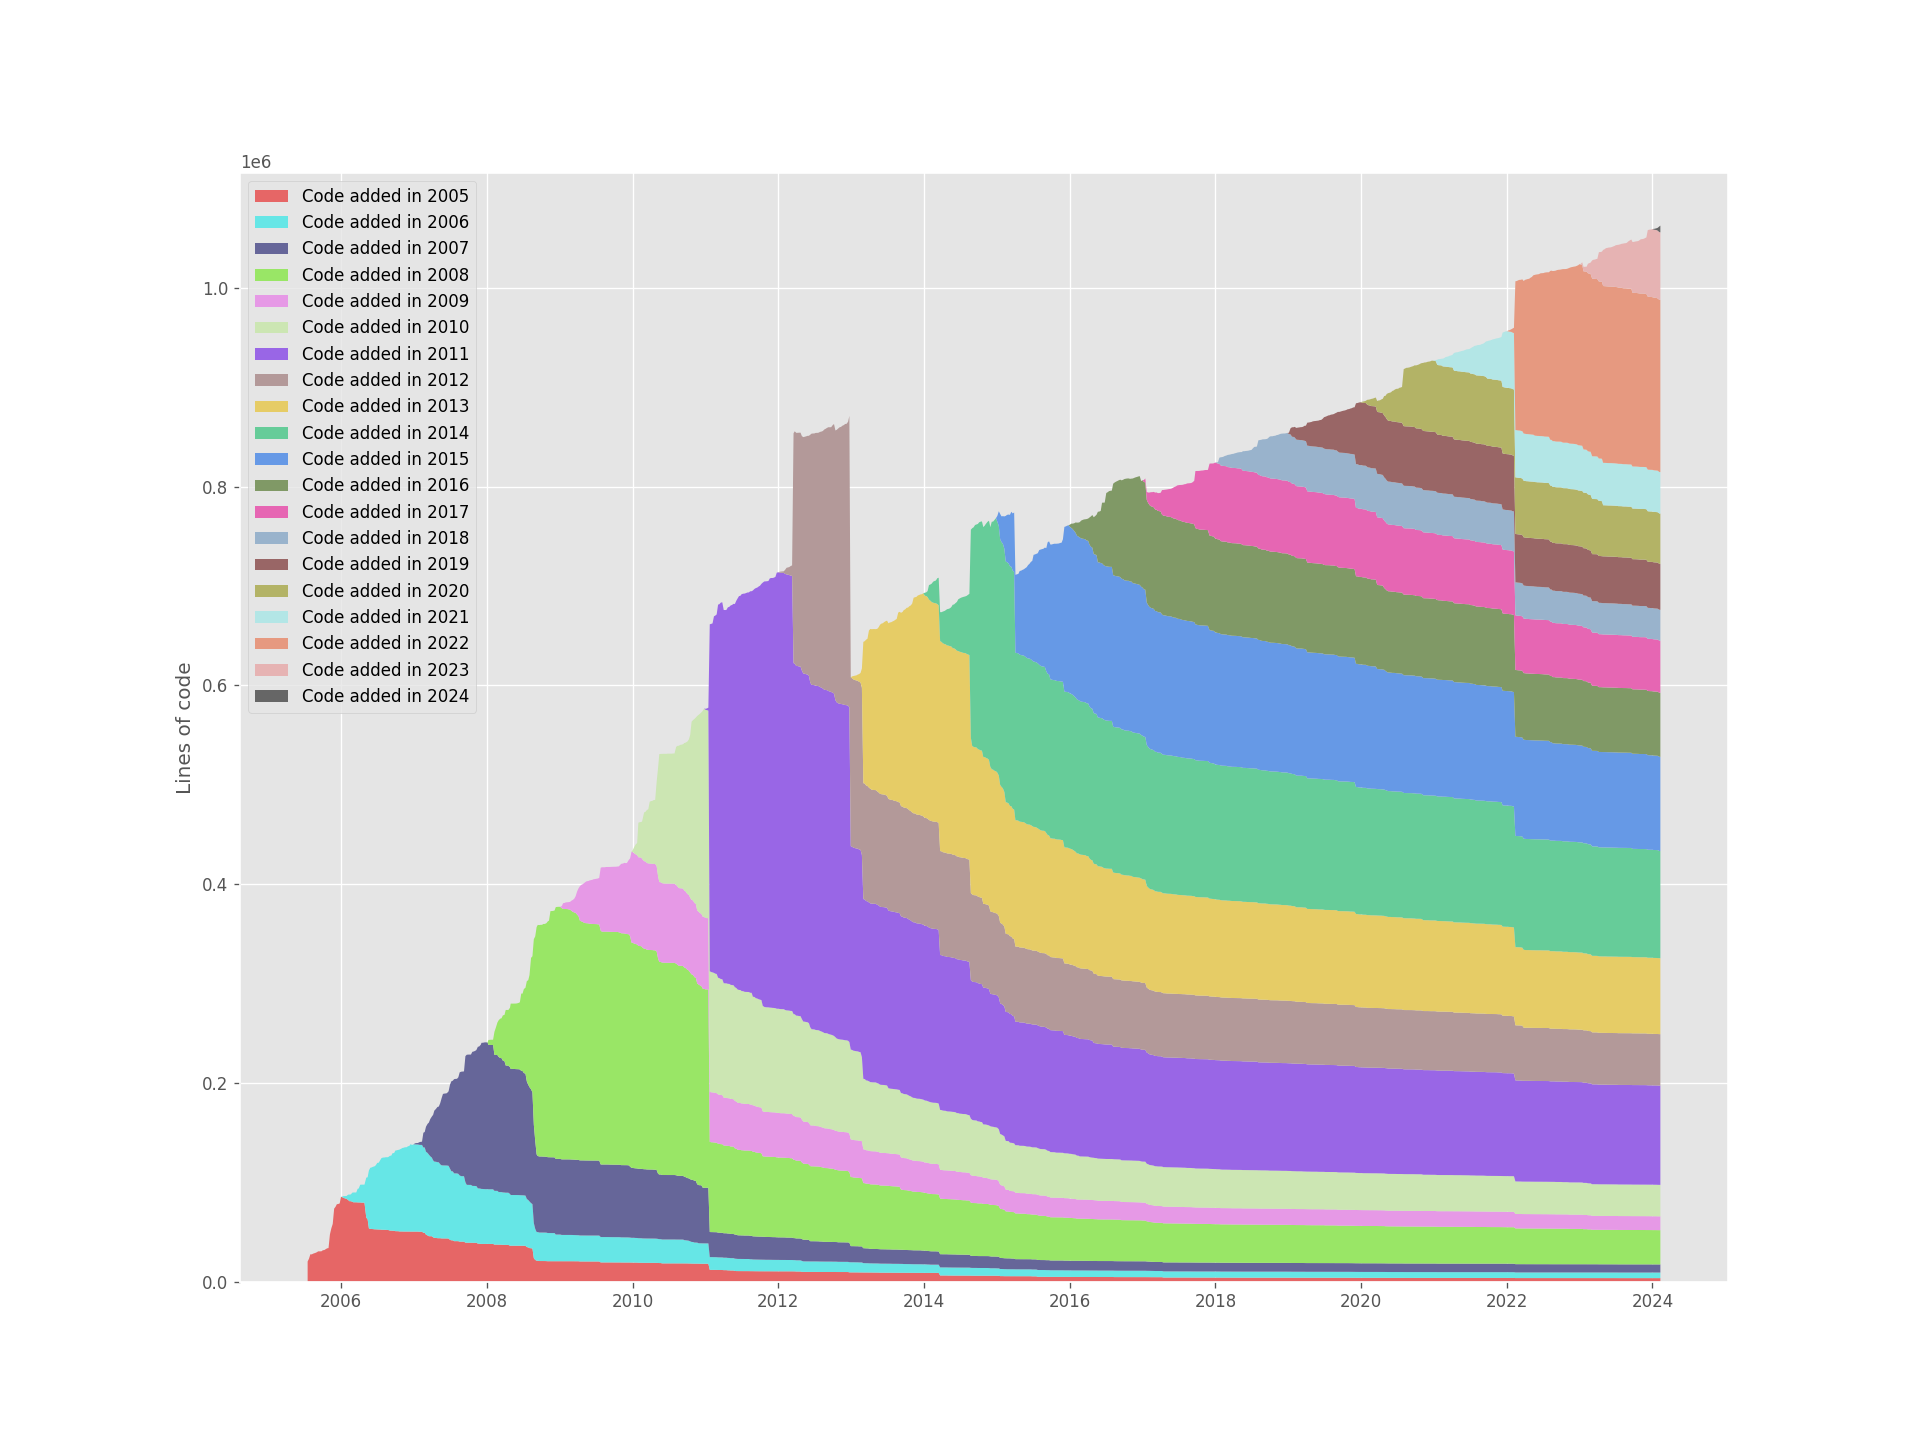
Postgres (19s to generate)
Django (5s to generate)
comments powered by Disqus